(T2108 measures the percentage of stocks trading above their respective 40-day moving averages [DMAs]. To learn more about it, see my T2108 Resource Page. You can follow real-time T2108 commentary on twitter using the #T2108 hashtag. T2108-related trades and other trades are posted on twitter using the #120trade hashtag)
T2108 Status: 24.2%
VIX Status: 23.6
General (Short-term) Trading Call: Hold – make sure bullish trades have some kind of hedge
Reference Charts (click for view of last 6 months from Stockcharts.com):
S&P 500 or SPY
SDS (ProShares UltraShort S&P500)
U.S. Dollar Index (volatility index)
VIX (volatility index)
VXX (iPath S&P 500 VIX Short-Term Futures ETN)
EWG (iShares MSCI Germany Index Fund)
CAT (Caterpillar)
Commentary
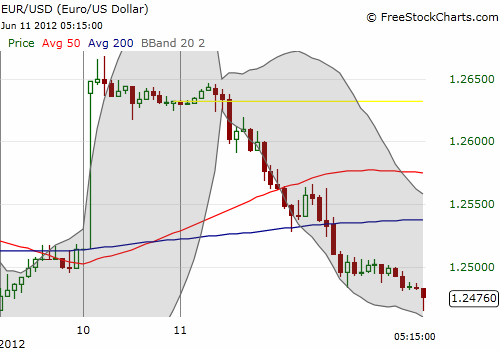
T2108 slipped back to 24% on a day full of false hope and a strong, ugly fade. I was surprised by the solidly positive initial response to the Spanish bank bailout announced over the weekend – for example, the Nikkei opened up 2%. The euro popped against all major currencies Sunday afternoon…except against the franc. This behavior prompted me to tweet the following: “If Spanish bank bailout is such good news, why $EURCHF struggling to gain? Hopefully, stocks can get at least one more good day out of this”. I even felt compelled to write a short blog post on this observation (see “Eurozone’s Woes Are Not Ending Until The Fat Franc Flies?“). As I have mentioned before, if you are trading right now, you absolutely must keep an eye on the currency markets. You are a currency trader whether you like it or not.
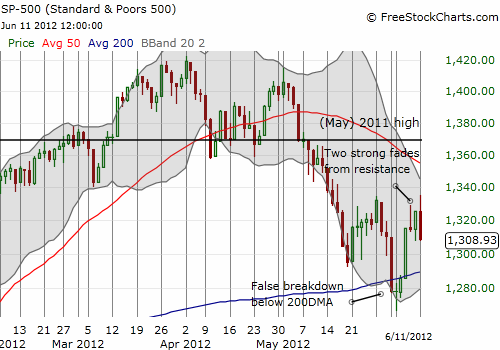
Even more strange to me was that European stock markets opened up over 1% even as it seemed clear by then the euro’s post-Spain boost peaked within two hours of the open of currency trading. Indeed, the euro finally started to fade against the U.S. dollar a few hours into the European trading session. By the time the U.S. stock market opened for trading, the euro had lost almost all of its post-Spain gains, and it is a wonder why/how our stocks managed any kind of strong showing. It did not last of course. The S&P 500 closed the day down 1.3% on a very nasty fade. Japanese traders are certainly going to feel betrayed by the time the Nikkei opens again today!


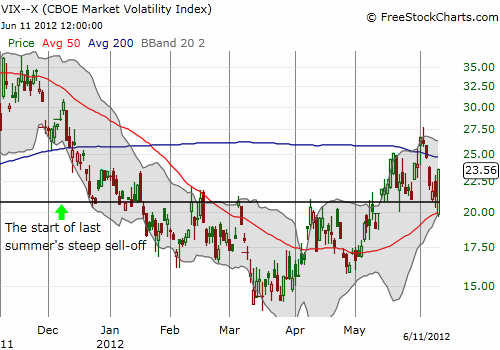
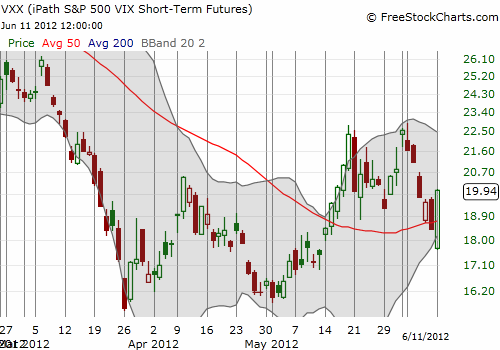
This second fade from resistance at the highs following May’s oversold period puts the S&P 500 right back in dangerous territory and provides my rationale for adding a hedge to the trading call. If the behavior of currency markets and the nasty fades in stocks do not convince you, then perhaps the impressive showing by the VIX will finally spark some more caution in your trades. Already wary, I added to my VXX calls (this time July expiration) soon after today’s open. The VIX never looked back after gapping down and ended up reclaiming the critical 21 level and then a lot more. The VIX bounced perfectly off its 50DMA. VXX, the iPath S&P 500 VIX Short-Term Futures, put on an even more impressive display with a bullish engulfing pattern that took it above its 50DMA. The next trip into oversold territory should include another test of the 200DMA. I am guessing right now support will prove much less resilient than resistance.
Finally, there are MANY examples of stocks with nasty fades and technical breakdowns including stocks like JPMorgan Chase which continue to struggle at flatline for the year. Given the current context, ALL such warnings must be taken very seriously. I recommend hedging as needed (for example, see “Hedge With HDGE For The Long Term, SDS For The Short Term“), but if/when T2108 flips oversold, I will still apply the same trading rules as always. Again, the current caveat is that I am only interested in holding bullish T2108 trades as swing trades (one to three days) after the oversold period ends.


On balance, I think the financial markets are now screaming an ever louder alarm at us. Even gold and silver managed to register positive gains despite the dollar’s strength. The inability of T2108 to retain some upward momentum off the previous oversold period adds to my alarm. I do not have definitive data on the implications of such a weak performance, but I interpret it as meaning a dip back into oversold territory is getting ever more likely for the very short-term.
Black line: T2108 (measured on the right); Green line: S&P 500 (for comparative purposes)
Weekly T2108

*All charts created using freestockcharts.com unless otherwise stated
Related links:
The T2108 Resource Page
Expanded daily chart of T2108 versus the S&P 500
Expanded weekly chart of T2108
Be careful out there!
Full disclosure: long SDS, long VXX calls, long JPM puts, net short euro

