(T2108 measures the percentage of stocks trading above their respective 40-day moving averages [DMAs]. To learn more about it, see my T2108 Resource Page. You can follow real-time T2108 commentary on twitter using the #T2108 hashtag. T2108-related trades and other trades are posted on twitter using the #120trade hashtag)
T2108 Status: 29.6% (Last oversold period ends at 4 days)
VIX Status: 21.0
General (Short-term) Trading Call: Hold, make sure at least one hedge remains active (click here for a trading summary posted on twitter)
Reference Charts (click for view of last 6 months from Stockcharts.com):
S&P 500 or SPY
SDS (ProShares UltraShort S&P500)
U.S. Dollar Index (volatility index)
VIX (volatility index)
VXX (iPath S&P 500 VIX Short-Term Futures ETN)
EWG (iShares MSCI Germany Index Fund)
CAT (Caterpillar)
Commentary
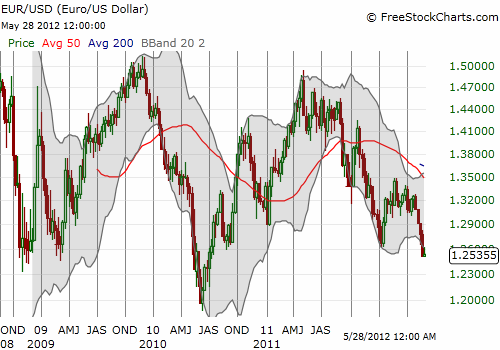
The good news is that T2108 continues to rise above oversold levels. The bad news is that the euro continues to sink.

I am more inclined to believe the bearish signals from the currency market because the forces wreaking havoc on European economies are tremendous. The currency market is also much bigger than the stock market and can (and will) flex its muscles in a much more forceful fashion than the reverse. So, today’s widely divergent behavior raised my suspicions and did not give me a faint hope that a lasting bottom is finally here.
The S&P 500 rallied for a 1.1% gain while the euro spent most of the session traveling downward against major currencies (back to two-year lows against the U.S. dollar). The VIX ended the day exactly on the critical support of 21. Given my wary eye on foreign exchange, I wasted no time jumping back into VXX calls as a hedge. (Also tugging on my strings of consternation is this fascinating and alarming piece by Simon Johnson and Peter Boone called “The End of the Euro: A Survivor’s Guide“).
I sold my last SSO calls on Friday ahead of the holiday weekend as planned. I felt a bit naked without anything to sell into today’s pop, but I am also quite comfortable with that. In the best case, the S&P 500 will rally into the 50DMA, another 3% away. At that point, I would look to start fading the index assuming T2108 is closer to overbought than oversold. Under the current circumstances, I highly doubt the index will make it that far before returning to oversold conditions. Despite my bearishness, I am not expanding any bearish positions because of the proximity to oversold conditions. Moreover, the euro itself is extremely oversold, and there is no telling when the massive shorts in the currency may get scared enough to scramble for cover.
With such a flurry of important technical and fundamental signals, I am bracing for a roller coaster of a week. May has been another historically awful month and the pressures to exit the market should be just as strong as they have been the last two summers. Yet, can the market really go through the exact same chaos three years in a row? Time will soon tell…
(Note – as of May 11, 2012, I am still trying to figure out how to make the S&P 500 overlay work better).
Black line: T2108 (measured on the right); Green line: S&P 500 (for comparative purposes)
Weekly T2108

*All charts created using freestockcharts.com unless otherwise stated
Related links:
The T2108 Resource Page
Expanded daily chart of T2108 versus the S&P 500
Expanded weekly chart of T2108
Be careful out there!
Full disclosure: long SDS, net short euro

