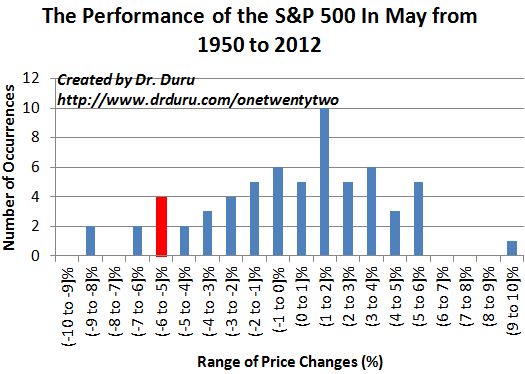
Another May and another horror show for the stock market. Excluding today’s oversold bounce currently underway, the S&P 500 (SPY) is down 5.7% for the month. The index was down as much as 7.1% last week. The chart below shows that these numbers are extreme even for a month that causes so much fear and consternation (“sell in May”). If the S&P 500 had finished at its lows for the month, the index would have recorded its third worst May since 1950. The only worse years were 1962 and 2010. As things stand now, this month is “only” the sixth worst May performance for the S&P 500 since 1950 (included in the red bar).

Source for prices: Yahoo!Finance
Be careful out there!
Full disclosure: long SDS
