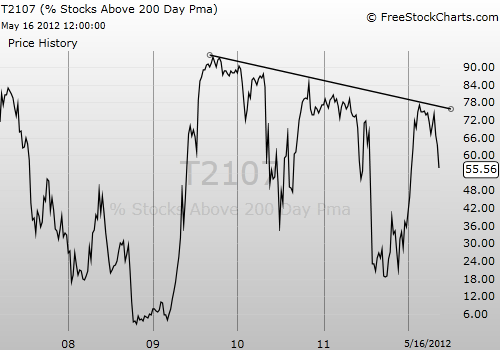
T2107, the percentage of stocks trading above their respective 200-day moving averages has been in decline since reaching a quick post-recession peak in late 2009. It is one sign that fewer and fewer strong stocks are supporting the overall stock market. So when the indicator takes a fresh plunge to the downside, I sit up and notice. Without the participation of strong stocks, the major indices will fall very fast and far…just like last summer…and the summer before that…

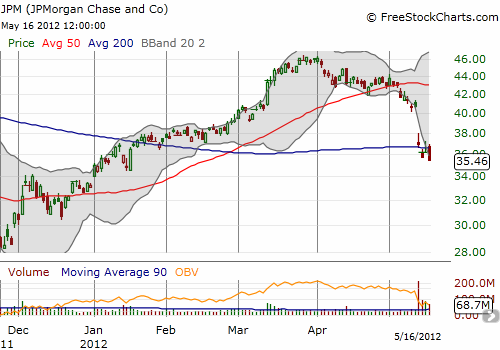
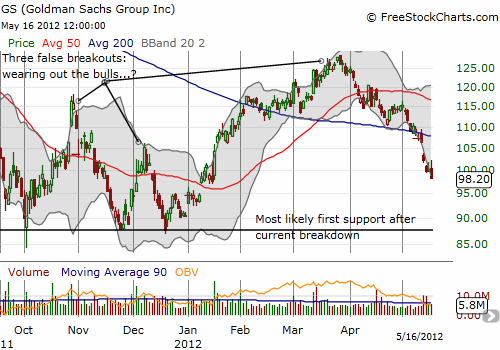
There are some very dramatic examples of stocks breaking down below their 200DMAs. I am starting to focus on them because T2107 suggests that these breakdowns are generating strong candidates for bearish positions. That is, once broken, the 200DMA switches from support to resistance. JP Morgan (JPM) and Goldman Sachs (GS) are today’s examples.
JPM was hit with bad news about massive losses in derivatives trading and hedging. JPM lost 10% last Friday, and the stock stopped just short of its 200DMA (again, you cannot make this stuff up!). This relief was short-lived as JPM started this week with a clean break of 200DMA support. Today, Wednesday, JPM confirmed the breakdown by trading to a new 4-month low. The stock is now a short candidate with a stop above $37 or $38.

Goldman Sachs is in a similar position to JPM. Interestingly, its breakdown started BEFORE JPM’s big loss. GS is now a whopping 23% below its recent highs. There is no clear support for the stock until last year’s lows. Needless to say, I need to dump my current position and/or buy puts.

Source for charts: FreeStockCharts.com
Be careful out there!
Full disclosure: long GS
