(T2108 measures the percentage of stocks trading above their respective 40-day moving averages [DMAs]. To learn more about it, see my T2108 Resource Page. You can follow real-time T2108 commentary on twitter using the #T2108 hashtag. T2108-related trades and other trades are posted on twitter using the #120trade hashtag)
T2108 Status: 21%
VIX Status: 20.4%
General (Short-term) Trading Call: Hold. (click here for a trading summary posted on twitter)
Reference Charts (click for view of last 6 months from Stockcharts.com):
S&P 500 or SPY
SDS (ProShares UltraShort S&P500)
U.S. Dollar Index (volatility index)
VIX (volatility index)
VXX (iPath S&P 500 VIX Short-Term Futures ETN)
EWG (iShares MSCI Germany Index Fund)
CAT (Caterpillar)
Commentary
Looks like the market is swiftly reaching for my worst case scenario from yesterday’s T2108 Update. Everything went wrong for the bulls today as buyers have now officially lost control of the market’s momentum.
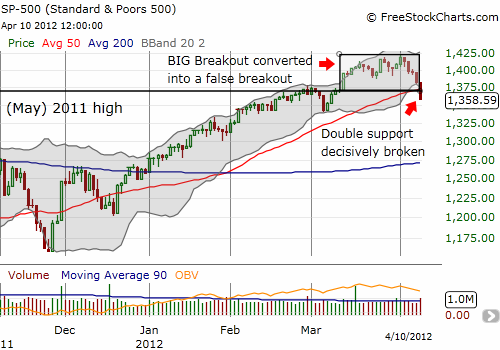
T2108 plunged all the way to 21% today, close to oversold conditions. I was anticipating oversold conditions, so I sold off all my VXX calls as planned. However, I decided to keep all my SDS shares. Given the worsening technicals, I will probably be more reluctant than usual to part with them. The S&P 500 dropped 1.7% and crashed right through its 50DMA. The critical March 13th breakout is now decisively erased. This move converts the last month of trading into a likely false breakout that should serve as relatively strong resistance for a while. Selling volume also surged. For example, trading volume on SPY, the SPDRs S&P 500 Trust Series ETF, surged to 235M shares. This is the highest trading volume since a bout of selling last December. (I consider the SPY trading volume to be more reliable in FreeStockCharts.com than the S&P 500 trading volume).

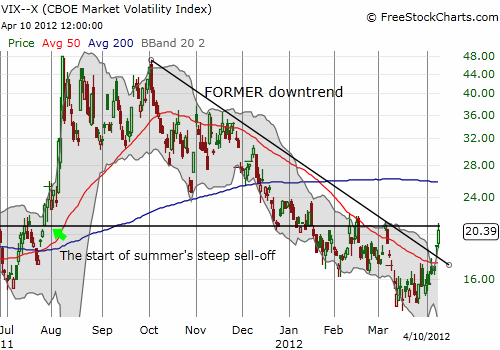
The volatility index, the VIX, jumped back to levels last seen during March’s swift pullback…which just happens to be the launching point for last summer’s steep sell-off. The VIX is now at its own critical juncture as it sits just under presumed resistance but also now has the benefit of the doubt granetd by its breakout from the former downtrend.

Given the awful technicals, T2108 should easily settle into official oversold territory tomorrow. This will only act as a final stamp of approval on top of the other signs I noted yesterday that suggested the market was already oversold. The HUGE problem going forward for T2108 trades is that the S&P 500 is nowhere near anything we can pragmatically call a “low price.” This means that bullish trades placed in these oversold conditions must be treated as short-term or swing trades. The short-term trades before this sell-off had short leases because I executed them without an oversold signal. The authentic oversold trades get a short lease because the bulls and buyers have lost control of the market’s momentum, and I have to assume that the resistance created by the false breakout will hold. This assessment will not change until the S&P 500 returns firmly into the breakout area by reversing all of today’s losses – a close above 1384 on the S&P 500. Until then, the bears and sellers retain the upper-hand.
Another implication of my more dour note is that it brings into play the worst case scenarios discussed in the last T2108 Update. At that time, I was VERY optimistic that it made sense to stick with the bullish history of extended overbought periods. Now, a worst case scenario of a double-digit drop looms as a larger possibility. A 20% drop takes the S&P 500 to a retest of last October’s lows. But one step at a time…
I nibbled on some more SSO calls today. I fully expect that the few SSO calls I held from earlier trades will now expire worthless (my first batch to go out without a profit!). I will likely soon switch to SSO shares instead of calls so that I need not worry about losing money from time premiums that erode as the market churns below resistance levels. I will be a little more aggressive with VXX puts once T2108 officially switches to oversold. Again, I will likely favor holding SDS shares throughout whatever difficult period seems likely. Probably only a return to the breakout area or a tremendous surge in volatility will convince me to sell these. Note that I also still hold FXP, the inverse of the iShares FTSE/Xinhua China 25 Index Fund. I will likely sell this bearish position once T2108 goes oversold. I do not want to be net bearish in an oversold period. Finally, I am not likely to actively short until/unless T2108 approaches overbought levels again (conditioned on the prevailing technicals of course).
My “Caterpillar (CAT) watch” further confirms the bearish bias in the market. CAT closed today just above $100. Its downtrend from February highs continues. CAT’s failed retest of all-time highs looms larger and larger now as a red flag. I sold my puts in CAT’s cousin Terex (TEX) given they expire next week.
I end with another look at the market’s poor trading volumes. My “twitter buddy” @fundmyfund tweeted with me today: “market up on vapor, down on volume. Since 2007…yes it makes no sense but the new era.” Folks like us have long complained that low buying volume and heavy selling volume are bearish signals. Yet, the “vapor” has been solid enough to propel the market for miles and miles. However, an interesting article in CNBC today provided a few explanations I had not yet seen or considered to explain the drop in trading volumes (overall). In “Where Has All the Trading Gone? Volume Hits 4-Year Low“, CNBC quotes analysts and data indicating that options volume has broken records for nine straight years. This suggests that equity traders are switching from stocks to options. However, as noted in “Apple’s Big Mystery Buyer in Q1 2012,” market makers must trade stock to offset and/or hedge the options trades they support. So, the net impact on stock trading volume from a switch by equity traders should theoretically be relatively small.
The article also notes that “high-frequency trading, which accounts for half of all market activity, has been on the decline since last summer.” That decline is probably evident in the much lower volatility this year. This change is perhaps a good thing overall for everyone. Yet, this change does not explain the declines seen before last summer.
Finally, the article also notes that “Citigroup (C) alone accounted for 7 percent of all volume in the second half of 2009 before its 10 for 1 reverse split.” In other words, simply by changing the amount of stock floated in the market, Citigroup may have significantly cut down trading volumes. Not to mention that the higher price points are less attractive to the “penny chasers” who prefer trading low-priced stocks because of the number of shares they can command. This is an important point to remember when an index becomes full of low-priced stocks as the S&P 500 did from 2008-2009.
Regardless, whatever the reason, until proven guilty, the persistence of low trading volumes remains a point of cocktail conversation, but it still has little bearing on our trading strategy.
Here is a chart from the article showing stock market trading volumes. Note the surges during times of duress in the market and the lack of volume during the times of rallies. (I will cover more extensive data again in another post. You can also see my last analysis in “T2108 Update – January 25, 2012 (Trading volume remains VERY light, too light)“).

Source: CNBC.com
Charts below are the latest snapshots of T2108 (and the S&P 500)
Refresh browser if the charts are the same as the last T2108 update.
Black line: T2108 (measured on the right); Green line: S&P 500 (for comparative purposes)
Weekly T2108

*All charts created using freestockcharts.com unless otherwise stated
Related links:
The T2108 Resource Page
Expanded daily chart of T2108 versus the S&P 500
Expanded weekly chart of T2108
Be careful out there!
Full disclosure: long SDS; long SSO calls; long VXX puts; long CAT shares and puts


Doctor,
About the options and stock volume, could not the market makers employ other stategies than buying stock to support their sale of options. Not sure but just like a bookie can they not just take equal amounts of each side of the options. Also, I have noted for a year that many have jumped on the options bandwagon. Two in a big way that I come into contact with are “Fast Money” tv show which now seems to be about 30% options and treats options users as prrescient and much smarter money than stock traders even though most options traders lose money and the most sure way to make a small fortune in options is to start with a large one (old joke). Second, TD ameritrade, my broker, has been pushing options like crazy after spending a ton to buy Investools that had the sinkorswim platform which was all about options. Who can blame the brokers when they make twice the commissions compared to stock.
What other ways would they hedge their exposure. Purchasing other options perhaps?
Regardless, I think your anecdotes further suggest that interest in options could be draining the interest in stocks. I love that joke! I have to remember it.
Now that I think about it, in an era of shrinking incomes, options could also be used to replace the lower purchasing power perhaps a lot of traders/investors now feel?