(T2108 measures the percentage of stocks trading above their respective 40-day moving averages [DMAs]. To learn more about it, see my T2108 Resource Page. You can follow real-time T2108 commentary on twitter using the #T2108 hashtag. T2108-related trades and other trades are posted on twitter using the #120trade hashtag)
T2108 Status: 55%
VIX Status: 15.7%
General (Short-term) Trading Call: Trade with a bullish bias – and a queasy stomach. (click here for a trading summary posted on twitter)
Reference Charts (click for view of last 6 months from Stockcharts.com):
S&P 500 or SPY
SDS (ProShares UltraShort S&P500)
U.S. Dollar Index (volatility index)
VIX (volatility index)
VXX (iPath S&P 500 VIX Short-Term Futures ETN)
EWG (iShares MSCI Germany Index Fund)
CAT (Caterpillar)
Commentary
The queasy bull is talking to me again. This time, he is bugging me about the seasonal weakness in stocks that typically begins in May. Before I cover that, I will do a quick review of where T2108 stands.
T2108 dropped to 55% as the S&P 500 nudged down a fraction of a percent. The week, month, and quarter started off just as I had hoped with a continuation and follow-through of the set-up discussed in the last T2108 Update. As a result, I was able to complete another very successful round of trades on SSO calls (yes, the T2108 portfolio is healing very nicely now). Today looked ready-made for another nice follow-through, but the minutes from the last Federal Reserve meeting apparently disturbed the groove as traders feared hawkish talk. I will take a quick moment to depart from the technicals just to say that hawkish talk at this juncture is a result of good economic prospects (as opposed to, say, concerns over a bubble or irrational exuberance), so I want to be VERY aggressive on buying any dips that are apparently catalyzed by such fears. I will be absolutely ecstatic if T2108 manages to get to oversold levels, but I do not expect such an event anytime soon.
Regardless, T2108 will remain firmly on the bullish side as long as it is not overbought given the bullish historic record I am following. I am still projecting T2108 to hit overbought levels in the “near future,” and I will reassess my bullishness at that time.
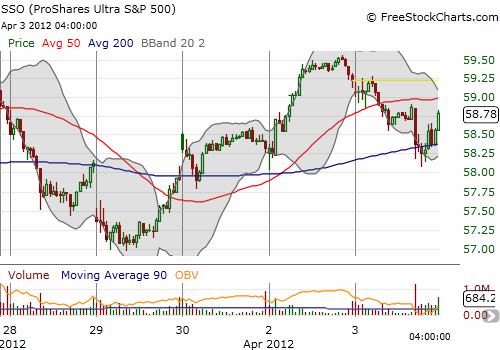
My current round of SSO calls were purchased multiple times. First, soon after the open on Monday, I purchased a fistful of weekly calls at the $59 strike. I was poised to buy a dip but the selling seemed to slow quickly, so I jumped in earlier than expected. With just a few minutes to spare, the S&P 500 took off for the rest of the day. Near the end of the day, I decided to sell $60-strike calls against that position to lock in a no-loss position. (I tweeted all this in real-time). This is a bit of an experiment. Today’s drop in the S&P 500 eliminated most of the profit on the long side, but also rendered the short side nearly worthless – net-net, still a winner. If SSO manages to climb over $59 again, I will have actually increased my gains by selling the calls. I used today’s dip before the Fed minutes to add to a position in SSO calls that expire April 21st. I was not able to buy another tranche on the Fed-driven dip, but I will be ready tomorrow to try again.

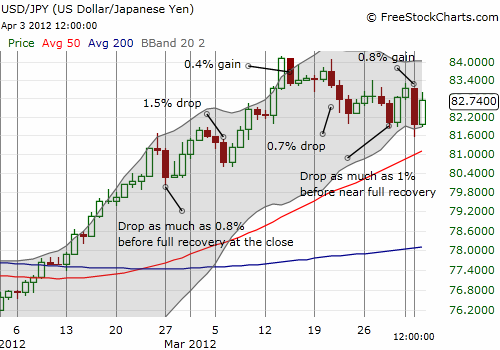
The big surprise on Monday came with the strength in the Japanese yen. Based on the recent correlation of strong yen and weak market, I was anticipating a much weaker open for the S&P 500. Even as the stock market rallied, the yen remained strong. Now, today, the yen weakened considerably as the S&P 500 took a nosedive. It is very possible the nice correlation is coming to an end, if it has not ended already. As with all such analysis, we must remain flexible and ready to learn new relationships. This looks like another one of those occasions. The chart below shows the Japanese yen versus the U.S. dollar (USD/JPY) with select days of yen strength (down candles) labeled with the performance of the S&P 500.

Now, I return to the queasy bull. Today’s trigger-happy reaction to the Fed minutes was surely overdone, but I respect it as a signal that the market may now be transitioning into a mood for finding reasons to sell off. The adage to “sell in May” is the most obvious one, but there are also growing fundamental concerns that are making the bears growl ever louder. Objections like unsustainable job growth in the U.S., a slowdown in China, and yet more sovereign debt concerns out of Europe. I am not here to say that these concerns are invalid. In fact, I hear a lot of sensible, valid-sounding bearish arguments that make my stomach turn and turn. However, T2108 is all about taking the emotion out of short-term trading, and I am actively working on using it to take the queasy out too.
I have looked several times at the data on the seasonal impact of “sell in May.” The last analysis was in 2011 as I discovered that the profits that traders can make during the summer come with high risks (see “Summer’s Positive Gains Can Come With High Risks“). I concluded with the following observation:
“If recent relationships hold, the lesson here is that betting on a positive summer this year is a good one given 2011 appears to be on track for a positive performance. However, if this assumption turns out the be wrong, it could be very wrong.”
For most of the rest of the year, this assumption looked very wrong indeed! The rally in the final months of the year healed the wounds. My bottom-line on “sell in May” remains that the summer is a time of opportunity, so buy the dips. It is also a time when sell-offs are particularly virulent. So, carry insurance. I will be even more vigilant this year using T2108 to navigate the choppy waters.
Charts below are the latest snapshots of T2108 (and the S&P 500)
Refresh browser if the charts are the same as the last T2108 update.
Black line: T2108 (measured on the right); Green line: S&P 500 (for comparative purposes)
Weekly T2108

*All charts created using freestockcharts.com unless otherwise stated
Related links:
The T2108 Resource Page
Expanded daily chart of T2108 versus the S&P 500
Expanded weekly chart of T2108
Be careful out there!
Full disclosure: long SDS; long SSO calls; long VXX calls and puts; long CAT shares and puts

