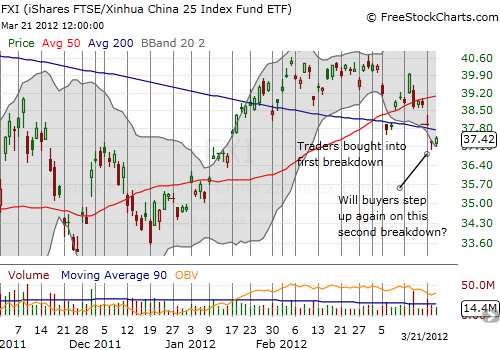
Two weeks ago, the iShares FTSE China 25 Index Fund (FXI) broke down below its 50 and 200-day moving averages (DMAs) just 5-6 weeks after an important breakout above these MAs. Buyers seemed to treat this as an opportunity to get into FXI before the breakout move resumed. Over the past two days, FXI has broken down again. Will buyers step up one more time?

This breakdown is one of those “obvious” technical setups that frequently gets faded to trap traders that are a bit too quick on the trigger. The quick recovery two weeks ago was an excellent example of this action-reaction. With China reporting a fifth straight month of contraction in manufacturing, this breakdown seems a lock for follow-through. However, this is still the “obvious” move, so I am not interested in pressing a short or puts or FXP, the inverse of FXI, until I see a new low for this week.
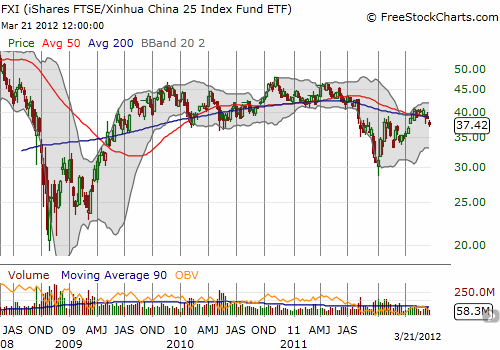
In the meantime, I am panning out the chart to recognize that FXI has been under-performing for a while. The weekly chart below shows that FXI printed a very marginal new post-crash high in November, 2010 and has cascaded lower ever since. It is very possible that traders have been pricing in a slowdown in China for quite some time. The final confirmation of such a slowdown may provide a catalyst for a rally, and NOT a new bear market.

Either way, I will be watching developments closely. While FXI only contains 25 stocks and is not a great proxy for the Chinese market, it is one of the better options U.S. traders have to play China directly. From that perspective, I find it useful.
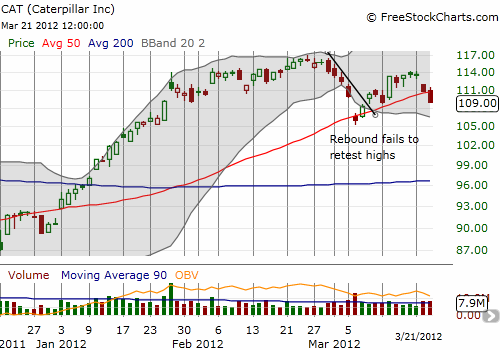
For an additional reference point, I am watching machinery and industrial giant Caterpillar ever more closely. As I mentioned in my last technical review of the market, CAT’s rally is starting to look exhausted. Today’s break down below the 50DMA is one more confirmation of that suspicion. While I still hold shares and call options, I moved in on puts in fellow machinery company Terex (TEX) as a first test of the blooming case for the bears.

Source for charts: FreeStockCharts.com
Finally, on a quick sidenote, I am also watching the Japanese yen as another signal that the market is starting to really worry about China. The yen has been sold nearly non-stop for six weeks now. If a strong bid returns to the yen, look out…
Be careful out there!
Full disclosure: long CAT shares and calls, long TEX puts
