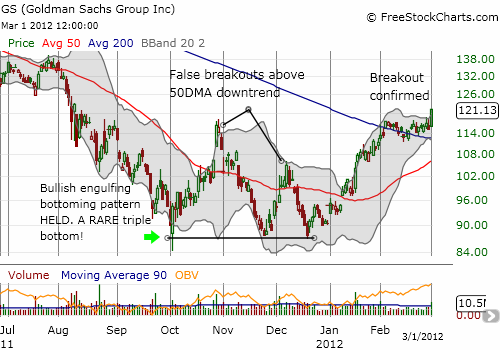
Every now and then I see a chart that undermines my expectation for an imminent pullback in the general market. This time, Goldman Sachs (GS) delivered the reluctant surprise. Today, the stock surged 5.2% to fresh 6-month highs.

Source: FreeStockCharts.com
This is what I had to say about GS in late January during a comprehensive chart review “bonanza”:
“Next to Intel, GS delivers one of the more surprising charts of the bunch. GS has somehow managed to pull off a rare triple bottom. This third breakout above the 50DMA decisively breaks a downtrend that has been in place since the beginning of 2011. Overhead resistance at the 200DMA should be tough to break, but I believe that GS has finally punched out a bottom. Perhaps just in time too: the support that held marks price levels last seen in March, 2009 (GS made a bottom in the financial panic in the Fall of 2008 and was a leading indicator of a decisive bottom in the stock market as a whole).”
The 200DMA indeed delivered tough resistance. GS followed its 200DMA downward for about two weeks before rifting away from it for another two weeks. Today’s surge provides separation from the consolidation and suggests that a fresh rally is underway for GS. The breakout for GS is confirmed.
With the 50DMA rising rapidly, and the 200DMA likely to provide firm support, Goldman Sachs has officially become a candidate stock for the “buy on the dips” list.
Be careful out there!
Full disclosure: long GS
