(T2108 measures the percentage of stocks trading above their respective 40-day moving averages [DMAs]. To learn more about it, see my T2108 Resource Page. You can follow real-time T2108 commentary on twitter using the #T2108 hashtag. T2108-related trades and other trades are posted on twitter using the #120trade hashtag)
T2108 Status: 83% (overbought day #28)
VIX Status: 20.8
General (Short-term) Trading Call: Close more bullish positions. Begin but do NOT expand an existing bearish position.
Reference Charts (click for view of last 6 months from Stockcharts.com):
S&P 500 or SPY
SDS (ProShares UltraShort S&P500)
U.S. Dollar Index (volatility index)
VIX (volatility index)
VXX (iPath S&P 500 VIX Short-Term Futures ETN)
EWG (iShares MSCI Germany Index Fund)
Commentary
Day #28 for this historical overbought period featured one of the bigger drops for the S&P 500 during this period. Friday was a rare day in which buyers actually failed to pick the S&P 500 much off its lows for the day. Still, the S&P 500 only lost 0.7% for the day, and trading volume did not pick up. The uptrend from the October, November, and December lows remains well intact.
The most interesting change was the 11.6% jump in the VIX. It gained as much as 18% at the day’s peak. I am surprised given this jump the stock market did not respond more strongly to the downside.

Notice that the VIX has risen steadily over the past week. Friday’s pop stopped perfectly at the 50DMA and the current downtrend line. If these forms of resistance break, it will likely signal the imminent end of this overbought period.
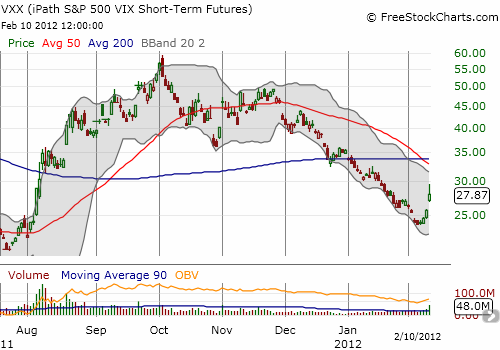
VXX also jumped, reminding me why I am stubbornly holding onto my VXX shares.

The jump in volatility compelled me to search for some fresh bearish positions. Google (GOOG) ended up as my prime target (for more see “Surge In Volatility Makes Google Puts An Attractive Short-Term Bearish Play“). I will be looking for additional candidates on Monday if volatility does not recede.
Another potentially ominous sign is a large pick-up in insider selling. Mark Hulbert from Marketwatch.com pointed out the following on February 9:
“Corporate insiders are now selling their companies’ stock at a rate not seen since late last July…Consider a ratio calculated by Argus Research of the number of shares insiders have sold in the open market to the number that they have bought. Last week, according to the latest issue of Argus’ service, the Vickers Weekly Insider Report, this sell-to-buy ratio stood at 5.77-to-1. And among insiders at companies listed on the New York Stock Exchange, this ratio was even more lopsided at 8.2-to-1.”
I rarely see these kinds of statistics presented with decisive evidence that the selling is correlated to peaks in the stock market, but the selling is at a minimum NOT a good thing. I would also prefer to know the dollar amounts being sold vs bought along with historical perspective. It makes a big difference if the shares being sold are triple-digit Apple or Google shares as opposed to single digit Bank of America shares. Even better would be a measure that is normalized by market cap or shares outstanding or even total shares held by the insiders.
Charts below are the latest snapshots of T2108 (and the S&P 500)
Refresh browser if the charts are the same as the last T2108 update.
Black line: T2108 (measured on the right); Green line: S&P 500 (for comparative purposes)
Weekly T2108

*All charts created using freestockcharts.com unless otherwise stated
Related links:
The T2108 Resource Page
Expanded daily chart of T2108 versus the S&P 500
Expanded weekly chart of T2108
Be careful out there!
Full disclosure: long SDS and VXX; long VXX puts

