(This is an excerpt from an article I originally published on Seeking Alpha on February 6, 2012. Click here to read the entire piece.)
Soon after Amazon.com (AMZN) reported earnings last Tuesday, I wrote a post concluding that AMZN stock was worth a buy as soon as the stock opened for trading on Wednesday. This recommendation was not based on the discount the market was offering (at the time around 10%). Instead, it was based on AMZN’s post-earnings trading behavior over the past three years… {snip}
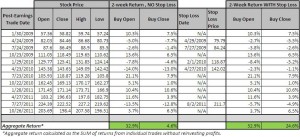
Now, as promised, here is a quantitative justification for this trade. The chart below summarizes the results (click for larger view):
Source: Price data from Yahoo!Finance
{snip}
Note the following observations from this table:
- Both strategies, buying on the open or the close, have a 7-5 win-loss record {snip}.
- Buying the open performs dramatically better than buying the close because of three trading cycles where buyers took AMZN much higher from the open on the very first day of post-earnings trading. {snip}
- The stop loss rule does not terminate any trades that would have otherwise delivered positive returns at the end of two weeks. {snip}
So far, so good on trading last week’s earnings. {snip}
The biggest irony of discovering this bullish trading pattern is that I have been mainly bearish on AMZN ever since it broke below its 200-day moving average (DMA) in late November. {snip}
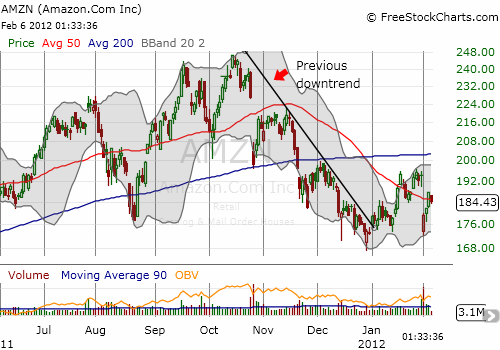
Finally, I reproduce the pre/post-earnings charts that inspired this trade. Refer to the previous post for more details.
2009 Q1
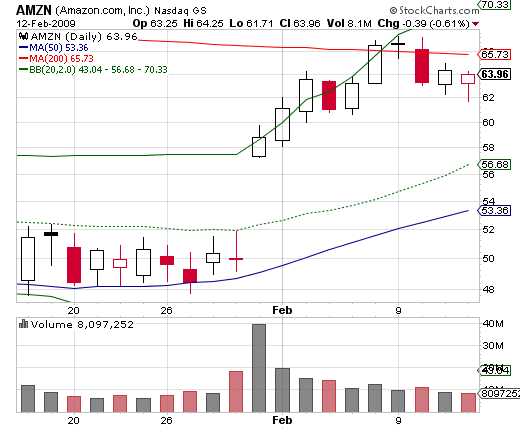
2009 Q2

2009 Q3
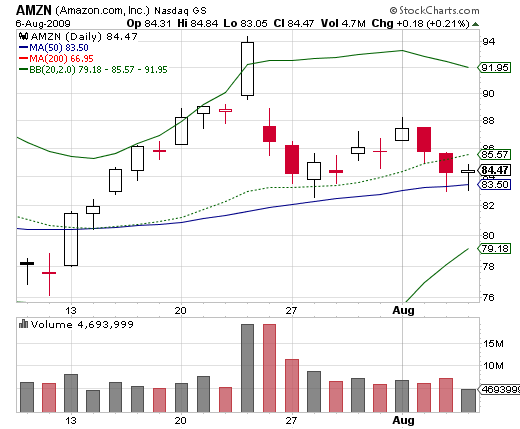
2009 Q4
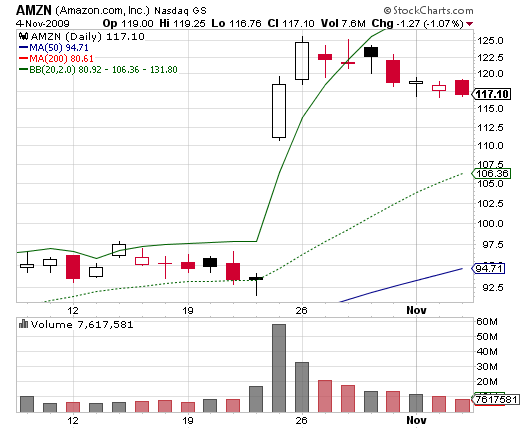
2010 Q1
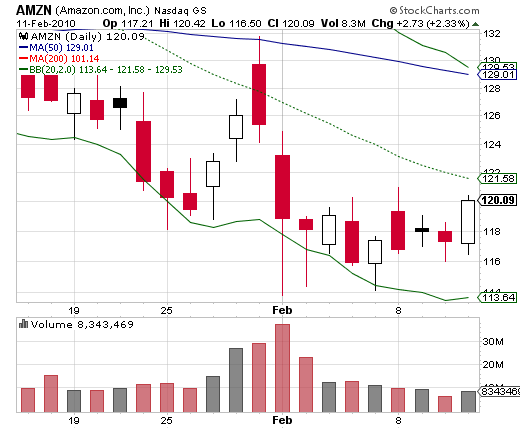
2010 Q2
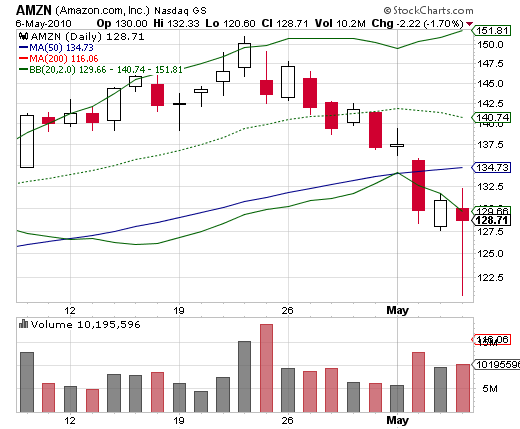
2010 Q3
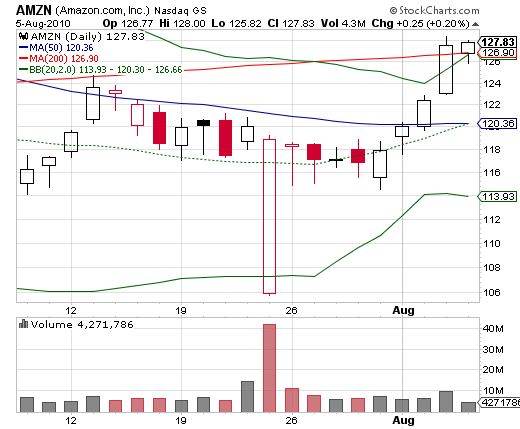
2010 Q4
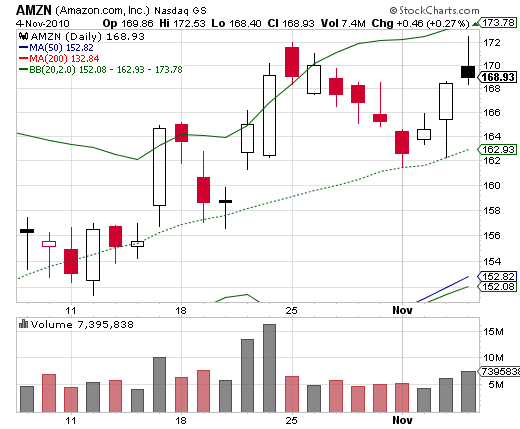
2011 Q1
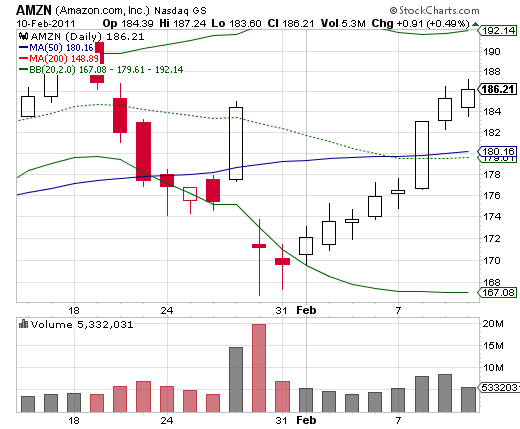
2011 Q2
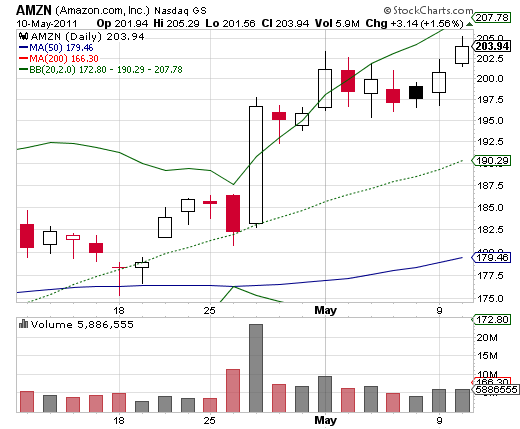
2011 Q3
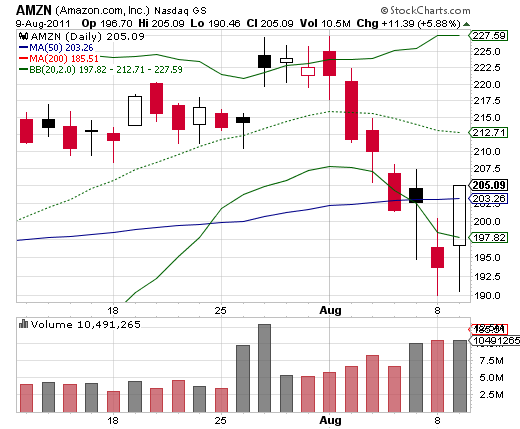
2011 Q4
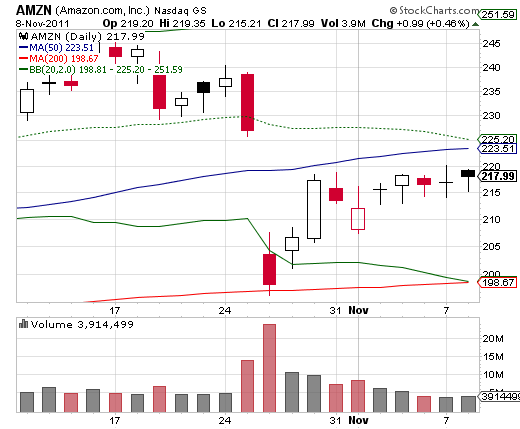
Source for charts: stockcharts.com
Be careful out there!
(This is an excerpt from an article I originally published on Seeking Alpha on February 6, 2012. Click here to read the entire piece.)
Full disclosure: long AMZN call spread
