(T2108 measures the percentage of stocks trading above their respective 40-day moving averages [DMAs]. To learn more about it, see my T2108 Resource Page. You can follow real-time T2108 commentary on twitter using the #T2108 hashtag. T2108-related trades and other trades are posted on twitter using the #120trade hashtag)
T2108 Status: 68%
VIX Status: 28
General (Short-term) Trading Call: Start building a bearish position. If holding bullish trading positions, close at least one. Otherwise hold.
Commentary
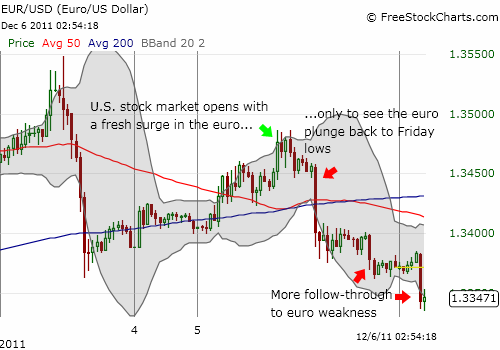
It was another day of europhoria without the euro. Once again, I found myself tweeting about the unconvincing nature of another small upward pop in the euro. This time, I was soon validated by a large plunge in the euro which brought the currency right back to Friday’s lows against the U.S. dollar. At the time of writing, the euro continues to dribble downward.
I use 30-minute bars in the chart below to highlight the dramatic change in fortune for the euro on an intraday basis.

The stock market has been surprisingly, even amazingly resilient, in the face of a wobbly euro. (I find it particularly amusing to see headlines attributing stock market strength to “positive” developments in the eurozone even as the euro’s attempts to rally continue to get faded). The S&P 500 has now knocked on overhead resistance for a third day in a row. Under different circumstances I would insist this behavior indicates a stubborn bullishness in the market; I would insist that the stock market is wearing down resistance. However, T2108 is now at 68% and almost overbought. The VIX is now on its fourth day below 30 – something that has not happened since the August swoon – with its 200DMA holding firm. Even if the S&P 500 manages to overcome resistance, the upside potential for the market seems very limited and not worth the risk. Granted, December tends to be a mild trading environment, especially with so many hoping for a “Santa Claus” rally. But I would prefer to prepare for a January fade whose virulence will be matched by the amount of complacency shown this month.
The upshot of all this is that IF the euro finally does surge with follow-through (and the U.S. dollar index finally drops out of its upward trending channel), the accompanying rally in stock markets could be very substantial. Overbought would simply get even more overbought, and I will return to counting down the days and comparing the period to historic periods of stubborn overbought conditions. This means that, for now, I cannot get aggressive with bearish positions even though 2011 is full of sharp sell-offs to end overbought periods. The last sell-off was another great example of this behavior. At the time, I stated I had learned my lesson to get more aggressive on the next overbought round. My large caveat (and clarification) is my preference to wait for overbought conditions to get very mature and extended before getting aggressive.
Charts below are the latest snapshots of T2108 (and the S&P 500)
Refresh browser if the charts are the same as the last T2108 update.
Black line: T2108 (measured on the right); Green line: S&P 500 (for comparative purposes)
Weekly T2108

*All charts created using freestockcharts.com unless otherwise stated
Related links:
The T2108 Resource Page
Expanded daily chart of T2108 versus the S&P 500
Expanded weekly chart of T2108
Be careful out there!
Full disclosure: long SDS, VXX calls, net long U.S. dollar, net short euro


Doctor, Hello again. As you can surmise I follow your advice closely and ever since T got to 24% a week or so ago I have been wondering why you insist on a level of 20% for oversold, especially since I thought 24% was a gift for those of us who got out during early November’s overbought period. Your statement today about waiting for maybe 3 more weeks (a January fade) was the tipping point for my writing to you.
So after rereeading your article on oversold periods it appears you arbitrarly chose 20% as convention and then tested the results of that. But upon looking at the daily T chart you put up in today’s article I noticed that only 3 of 6 plunges from above 70% made it to below 20% (3 made it to below 30 and 2 less so low). So, did you ever try using 30% especially with the conservative approach or trying to find the optimal percentage?
Best.
That’s a tough question. In 2010, T2108 indeed would only go so far as 30% before the S&P 500 would bounce back. But 2010 was also a much more bullish year than this one. After a while, I finally got hip to the 30% level and declared THAT close enough but only on a temporary basis. I would not let this ONE time bouncing from 24% to shift back to assuming 30% is the lower bound. I am sticking to 20%. One approach to dealing with the band of uncertainty is to just establish a SMALL position at 30% and wait and see what happens from there. That’s what I *might* recommend next time we are selling off. I hope that’s clear…?
Must be good advice as thats what I did.
Thanks for responding.
Cool. I should have added that additional indicators help here as well. The biggest thing I missed in the last sell-off was that stochastics had become VERY oversold. That should have been enough motivation to at least try a quick trade. I won’t miss THAT again.