(T2108 measures the percentage of stocks trading above their respective 40-day moving averages [DMAs]. To learn more about it, see my T2108 Resource Page. You can follow real-time T2108 commentary on twitter using the #T2108 hashtag. T2108-related trades and other trades are posted on twitter using the #120trade hashtag)
T2108 Status: 62%
VIX Status: 28
General (Short-term) Trading Call: Fade next rally, especially if you missed fading Friday’s rally. Otherwise hold.
Commentary
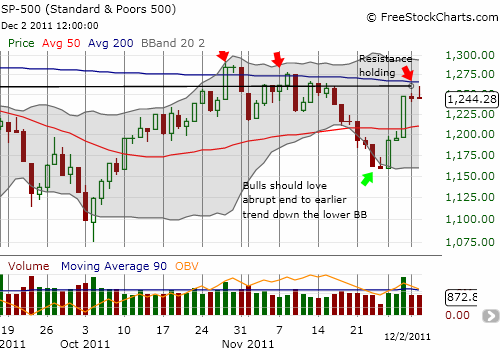
T2108 slightly increased from 60% to 62%. During the trading day, I assumed that the initial rally took T2108 toward, if not into, overbought levels. On that assumption, I added to bearish positions with SDS shares and new VXX calls. The fade of the S&P 500 from presumed resistance around 1260 certainly seemed to confirm overbought status. The chart below zooms in to highlight the resistance still in place from the previous 2011 lows (straight line) and the 200DMA. Note that the S&P 500 slowly faded throughout the day, nothing too abrupt.
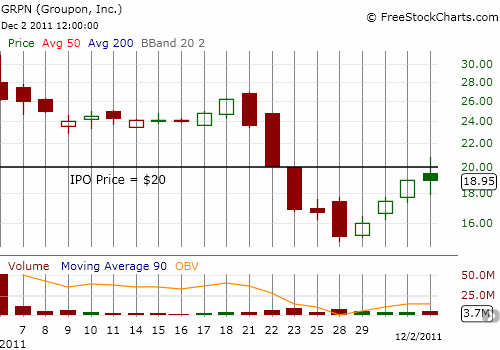
I even went after Groupon (GRPN), which I think will be worthless within 2 or 3 years, with some puts as it re-achieved its original IPO price of $20.
The dollar index survived last week’s version of manic switching from “europphobia” to “europhoria” (terms I am borrowing from a good friend). The euro spent a lot of time fading from initial bursts of excitement. I chronicled the euro’s wobbly rise all week to demonstrate that currency markets are not nearly as excited as stock markets are about the prospects in the eurozone. The hourly chart below shows that Friday featured the strongest intraday fade for the week, bringing the euro right back to the highs of Monday’s quick burst of euphoria.
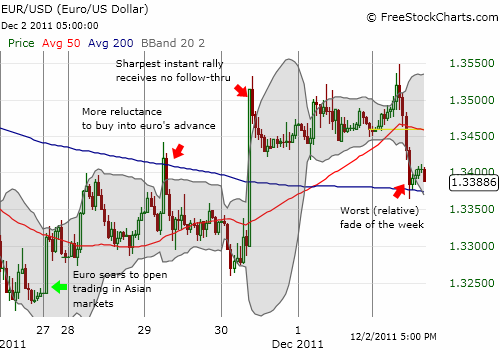
In other words, the quickness to fade the 1-2 hour bursts is a red flag. These bursts are likely caused by shorts rushing for the exits all at once, in a panic, in reaction to the latest headline. The rallies end quickly, and even get faded, because fresh buying interest remains very weak. Friday’s fade was the ugliest of the week and suggests the euro will soon lose what is left of the week’s gains…on its way to even lower levels. The euro is only about 2% away from its 52-week low against the U.S. dollar. While the S&P 500 was exceptionally resilient in the face of this currency action, I doubt the stock market’s own euphoria will last much longer without better cooperation from the euro.
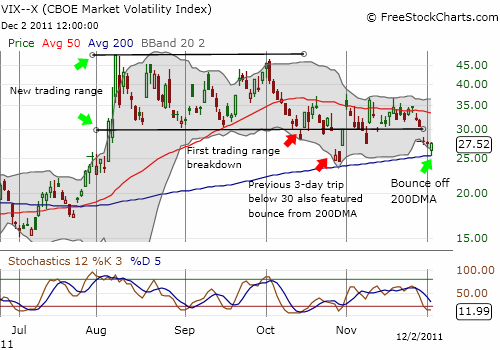
The VIX has spent no more than three days below 30 since the August swoon. Friday was the third day. To avoid making it a fourth day, the VIX would have to pull off a large leap. Possible but not likely. However, I do expect the VIX to eventually get above 30 but not much further. December tends to be a month of hope and good tidings, so it typically takes a LARGE catalyst to get the market to sell-off significantly. December can feature low-volume buying that sends the market drifting with an upward bias. In such cases, however, January, can mark the return of the sellers…often with swift action. Note in the chart below that the VIX neatly bounced off its 200DMA. As the 50DMA and 200DMA converge on 30, I imagine a day is coming where the VIX finally breaks up or down away from 30 in a more sustained fashion.
I will end with a few more telling charts that tell bullish and bearish stories.
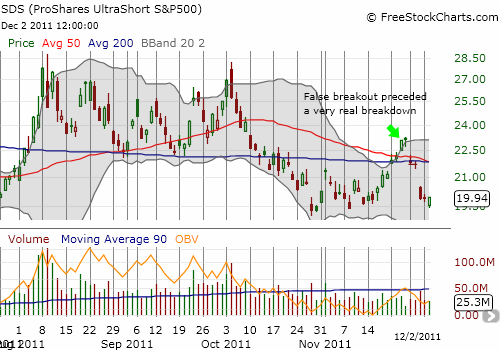
Last week, I pointed to a breakout of SDS (iPro Shares UltraShort S&P 500) as a bearish sign for the market. That breakout turned out to be a false alarm. SDS is now testing its all-time lows. I am of course betting on a bounce, but if SDS breaks down further it could market the beginning of a long slide. This is a chart to watch closely.
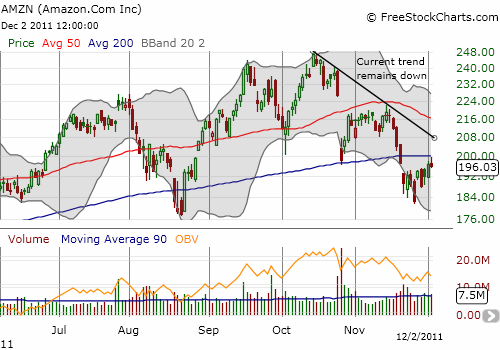
Amazon (AMZN) has gone from a very ominous breakdown to a retest of its 200DMA. The first test failed as AMZN faded. Even if AMZN finally rises above the 200DMA, it will contend with more stiff resistance from a declining 50DMA and a steep downtrend.
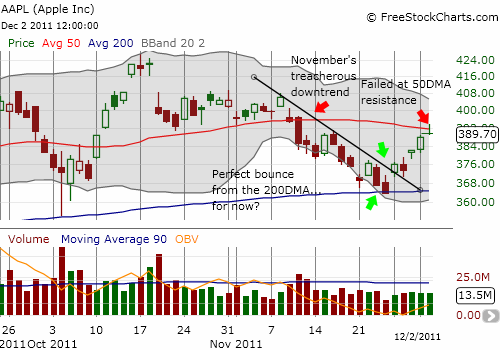
Closing the short side of my Apple (AAPL) January call spread last Friday turned out to be quite fortuitous. AAPL rose for most of the week although on very low volume. I decided to sell the long side of the call spread upon the test of the 50DMA. AAPL failed that test. A break below Friday’s low could bring swift follow-through to the downside. On the positive side, AAPL finally broke its treacherous downtrend from November. The stock should find firmer support at the convergence of the former downtrend and the 200DMA if it sells off again.
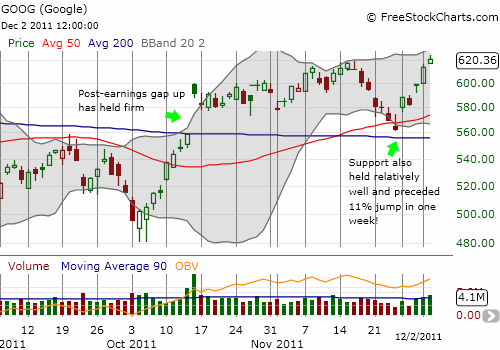
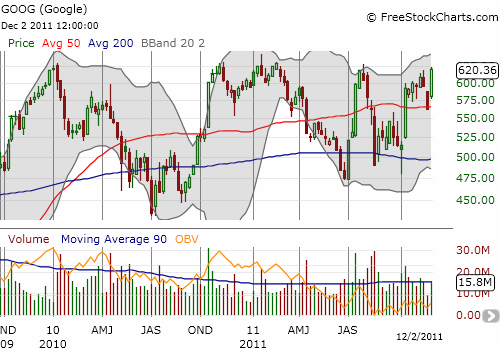
I pointed to Google (GOOG) earlier this week as having a bullish chart. Amazingly, GOOG closed the week with an 11% gain. This would be significant for any stock, but GOOG has gone nowhere for two years. The stock has spent most of these two years in negative territory for year-to-date performance. Last week’s surge places GOOG directly at important resistance. Even with T2108 at overbought I would not short a stock like this. Two years is a long time for a spring to wind up…
Charts below are the latest snapshots of T2108 (and the S&P 500)
Refresh browser if the charts are the same as the last T2108 update.
Black line: T2108 (measured on the right); Green line: S&P 500 (for comparative purposes)
Weekly T2108

*All charts created using freestockcharts.com unless otherwise stated
Related links:
The T2108 Resource Page
Expanded daily chart of T2108 versus the S&P 500
Expanded weekly chart of T2108
Be careful out there!
Full disclosure: long SDS, VXX calls, long GRPN puts, net long U.S. dollar, net short euro, long Apple call, long AMZN put spread

