(T2108 measures the percentage of stocks trading above their respective 40-day moving averages [DMAs]. To learn more about it, see my T2108 Resource Page. You can follow real-time T2108 commentary on twitter using the #T2108 hashtag. T2108-related trades and other trades are posted on twitter using the #120trade hashtag)
T2108 Status: 65%
VIX Status: 28
General (Short-term) Trading Call: Identify stocks for shorting on failure at resistance. Otherwise hold.
Commentary
So many positive headlines and catalysts today! Yet, as usual, I will not refer to them for interpreting the market’s short-term direction. Note well that I DO read and follow the fundamentals (see other posts for example), but the T2108 Update is much more about interpreting what the market IS doing and not what it SHOULD be doing. T2108 Update focuses on following simple rules that help traders tune out the noise of the headlines.
Anyway, after today’s open, I figured T2108 would soar, but the near DOUBLING to 65% knocked me right off my rocker. In Monday’s update, I noted that the S&P 500 has established a pattern of at least 1-day follow-through to strong rally days. Today’s continued follow-through and STRONG close was about as loud and convincing as a trader can hope for! Once again, I find myself lamenting T2108’s inability to officially swing oversold before this wonderful upside ignited, but I do feel huge relief that I was advising taking some profits on bearish positions during the last swoon. Obviously, my revised downside forecast for T2108 to go oversold before flipping overbought is essentially invalidated. I got a little over eager after my previous forecast to hit the 20-30% range proved correct!
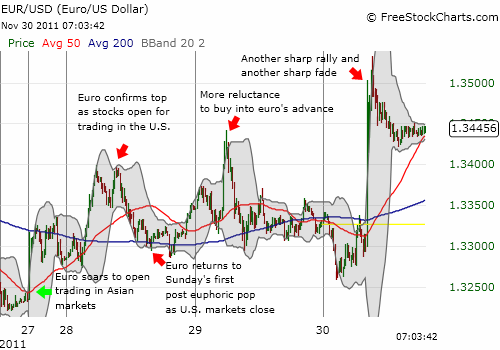
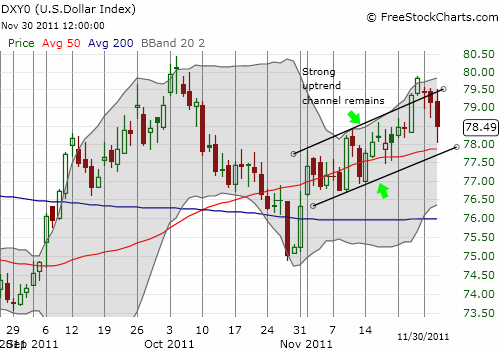
So what now? T2108 is almost overbought again, and, to me, the danger signs are screaming even louder everywhere I look under the covers. These monster gains from just two days of trading (Monday and Wednesday) seem almost certain to have an identical, evil twin waiting with open, mischievous arms sometime soon. Just like Monday, the euro faded all day against the U.S. dollar even as the S&P 500 held firm and rallied further. The euro ended the U.S. trading day retesting Tuesday’s highs. Not a bad showing, but not a strong vote of confidence either. Accordingly, the U.S. dollar drifted slowly upward for most of the day. It closed down but remains firmly planted within the current upward trend channel and even above the rising 50DMA. As a reminder, a close below this channel swings my bias closer to the bullish camp (on stocks).
The chart below of EUR/USD is divided into 15-minute increments to show the intraday trading action.
The S&P 500’s next test is the double resistance of the former support from 2011’s earlier lows and a now declining 200DMA.
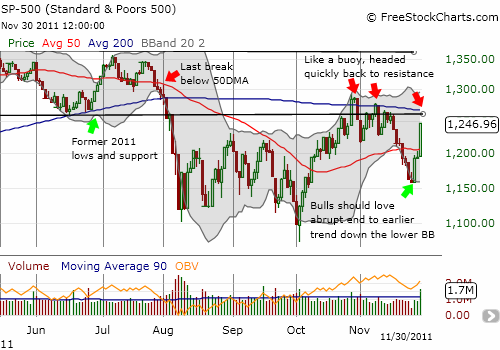
In favor of the bulls is the large surge in buying volume that sliced the index right through presumed resistance at the 50DMA (recall my commentary regarding the weakness of the 50DMA as demonstrated by the feeble support it provided last week as the market dropped out of overbought conditions).
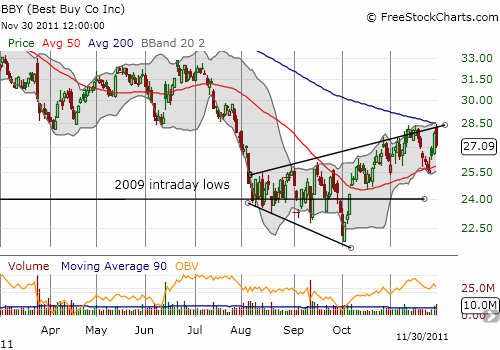
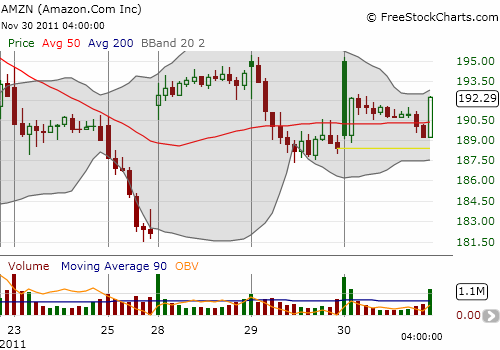
I tweeted all day about danger signs indicating this rally had weak underpinnings. Looking back, I realize now that I was seeking confirmation of my bias. After looking at a variety of individual stocks, I see tremendous divergence in performances. This is definitely NOT a time to overplay T2108 using individual stocks. Indices will be much more reliable. Having said that, weakness in Best Buy (BBY) – it faded from resistance at the 200DMA for a LOSS of 2.8% on the day – caught my close attention. Amazon (AMZN) faded from the open and actually lost ALL its gains at one point before reluctantly clawing back to a 2% close. AMZN remains below BOTH its 50 and 200DMAs. Finally, Apple (AAPL) disappointed with a “paltry” 2.4% gain making for relatively weak performance given Intel (INTC) surged 5.6% and the NASDAQ gained 4.1%. (For my last post on BBY, see “Chart Review: Best Buy’s Widening Wedge.” Note that I decided to sell my shares into the last rally.)
This chart of Aamazon is divided into 30-minute increments.
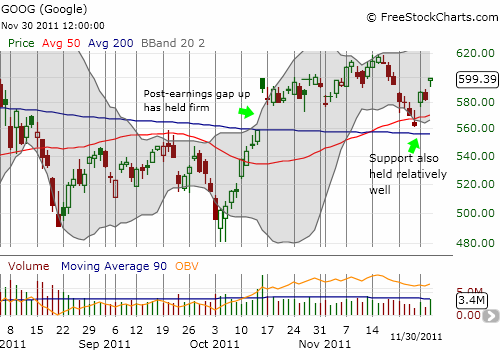
On the bullish side, Google (GOOG) continues to bounce well off the double support from the 50 and 200DMAs. GOOG has held onto its last post-earnings gap up.
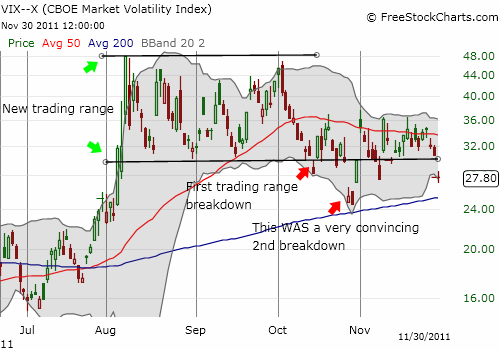
Finally, the VIX lost a whopping 9% and closed under 30 again. Since the August swoon, the VIX has spent little time under 30. I fully expect a repeat performance. To that end, I took advantage of the 9% drop in VXX to buy more calls. This time, I chose calls expiring in mid-December since the odds have substantially increased for upside versus more downside over these next 2 1/2 weeks.
Note well that I am still NOT getting aggressively bearish. I am assuming this rally will end at the 200DMA resistance, but I am content to wait until sellers “prove it” and/or T2108 closes in official overbought territory (70% or higher) before substantially increasing bearish positions. T2108 at 80% or more will make me aggressively bearish (following confirmation of an important lesson from the last overbought period!).
Some reading of interest in light of today’s trading:
Bespoke Investment Group suggests that buyers are rushing to “junk” stocks for quick trades. This kind of burst in speculative activity is usually considered a sign of a short-lived rally. See “Extreme Bottom Feeding This Week.”
“Frustrated by market volatility over the European debt crisis and uncertain U.S. economic outlook, the so-called smart money-hedge funds-has thrown in the towel for 2011 and pulled out of stocks, according to fund managers, SEC filings and exchange data…Hedge funds have slashed their exposure to stocks-both on a long and short basis-to the lowest level since 2008, according to Bank of America Merrill Lynch analysis of SEC disclosures and NYSE and Nasdaq data…Their net long exposure to stocks plummeted by more than a third, the biggest drop since 2009…” See “Hedge Funds Dump Stocks, Hoping for Rebound in 2012.”
Charts below are the latest snapshots of T2108 (and the S&P 500)
Refresh browser if the charts are the same as the last T2108 update.
Black line: T2108 (measured on the right); Green line: S&P 500 (for comparative purposes)
Weekly T2108

*All charts created using freestockcharts.com unless otherwise stated
Related links:
The T2108 Resource Page
Expanded daily chart of T2108 versus the S&P 500
Expanded weekly chart of T2108
Be careful out there!
Full disclosure: long SDS, VXX calls, net long U.S. dollar, net short euro, long Apple call, long AMZN put spread

