(T2108 measures the percentage of stocks trading above their respective 40-day moving averages [DMAs]. To learn more about it, see my T2108 Resource Page. You can follow real-time T2108 commentary on twitter using the #T2108 hashtag. T2108-related trades and other trades are posted on twitter using the #120trade hashtag)
T2108 Status: 33%
VIX Status: 32
General (Short-term) Trading Call: Identify stocks for shorting on failure at resistance.
Commentary
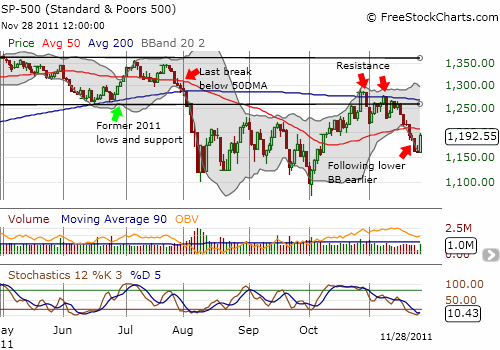
T2108 closed on Friday’s shortened session at 24%. Close but not close enough to oversold. I was ready to dip into a new position in SSO on Monday with the assumption T2108 would quickly slip to 20% and lower. Instead, T2108 jumped to 33%, and the S&P 500 rallied as much as 3.3% before closing with a 2.9% gain. Market technicians dream about timing these kinds of oversold bounces.
While I am VERY disappointed I missed such a tremendous upside trading opportunity, I am focusing on the next opportunity. After T2108 hit my first downside forecast to the 20-30% range, I revised my assessment to an even more bearish short-term outlook: rallies should be faded at resistance until T2108 becomes oversold. (I get bullish again ONLY after the S&P 500 shows some strength again above its 200DMA).
On Monday, the S&P 500 stopped short of its 50DMA by about 1%. The 50DMA only provided brief support a little over a week ago, so it is reasonable to assume that 50DMA resistance will not last long if sentiment is shifting. Moreover, notice from the chart below that, since the August swoon, the stock market has followed through on big rally days like today’s for at least a day.

Note well that stochastics are also extremely oversold. This condition supported today’s rally and increases the likelihood of some follow-through.
Despite the tinges of positivity, I decided to proceed with a few bearish positions. In particular, I bought some VXX calls that expire on Friday. If VXX calls are going to make some profit in the next few weeks, it will be this week and not from paying large time premium and waiting out two swings (first down and then back up). I will next watch to see whether the S&P 500 can close above its 50DMA and then follow-through. If the S&P 500 fails at resistance, I will replenish my existing SDS position.
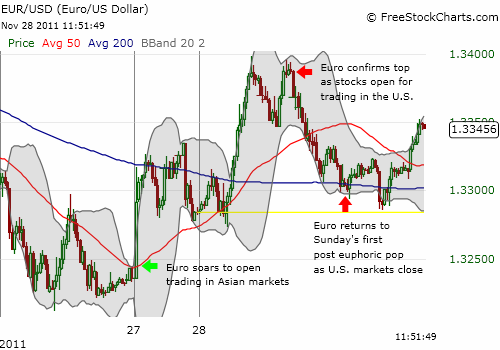
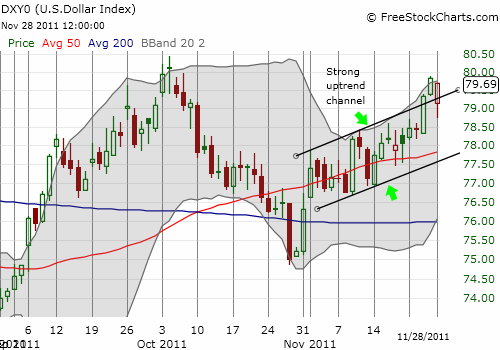
Interestingly, currency action was not confirming the bullish stock action. The U.S. dollar index rose for the entire day as the euro topped out against the U.S. dollar. and even traded back to levels from Sunday afternoon’s initial pop.


I expect the underlying sentiment of the market to remain bearish as long as the dollar continues to creep along the upward trending channel shown above. For more on my current thinking on the U.S. dollar see “Global Economic Pressures Continue To Push The Dollar Reluctantly Higher“.
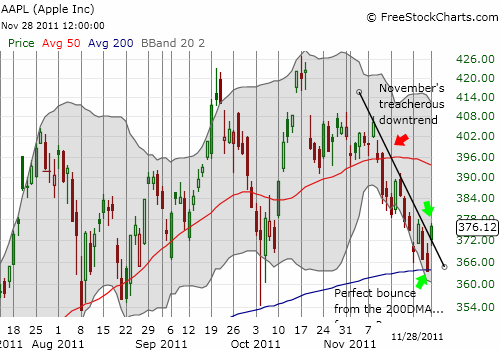
One bullish move I DID make on Friday was to close out the short side of my long-held January call spread in Apple (AAPL). Technically, you might call this a “close enough to oversold” kind of move, but I was more interested in playing AAPL for a bounce off its 200DMA – especially given AAPL sold off to this support line just as I projected. So far, so good.

Charts below are the latest snapshots of T2108 (and the S&P 500)
Refresh browser if the charts are the same as the last T2108 update.
Black line: T2108 (measured on the right); Green line: S&P 500 (for comparative purposes)
Weekly T2108

*All charts created using freestockcharts.com unless otherwise stated
Related links:
The T2108 Resource Page
Expanded daily chart of T2108 versus the S&P 500
Expanded weekly chart of T2108
Be careful out there!
Full disclosure: long SDS, VXX calls, net long U.S. dollar, net short euro, long AAPL call


I watch several “stock pickers” and you are the best by far. You writing is very clear, to the point, non arrogant, and genuine. I really enjoy your work.
Best Regards,
Sam
Thanks, Sam! I always appreciate knowing that I am helping someone out there.