(T2108 measures the percentage of stocks trading above their respective 40-day moving averages [DMAs]. To learn more about it, see my T2108 Resource Page. You can follow real-time T2108 commentary on twitter using the #T2108 hashtag. T2108-related trades and other trades are posted on twitter using the #120trade hashtag)
T2108 Status: 25%
VIX Status: 34
General (Short-term) Trading Call: Close at least one bearish position, otherwise hold.
Commentary
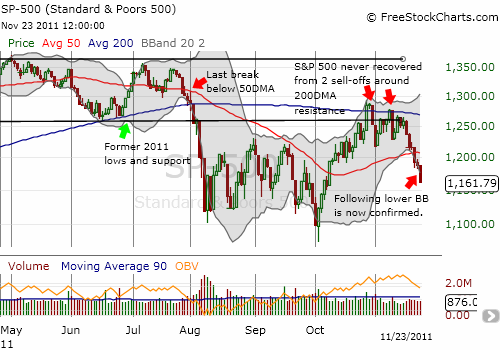
T2108 closed at 25% and hit the middle of the latest forecast for T2108 to drop between 20-30%. I now expect T2108 to soon enter oversold territory (20% or below). Moreover, this visit to oversold territory should prove almost as gut-wrenching as the last cycle. As a reminder, the S&P 500’s close below the 50DMA (on Monday, Nov 21) invalidated my previous bullish forecast for the S&P 500 to establish a higher trading range after working off overbought conditions. In fact, the current sharp plunge from overbought conditions resembles past drops from overbought conditions this year – a lesson to remember for 2012.
The overall technical condition of the S&P 500 continues to deteriorate at a rapid clip. The current pattern on the S&P 500 is now very similar to the slide from late July to August: the slide along the lower-BB is now confirmed. This development is ominous and warns us that a retest of the 52-week lows has a high probability.

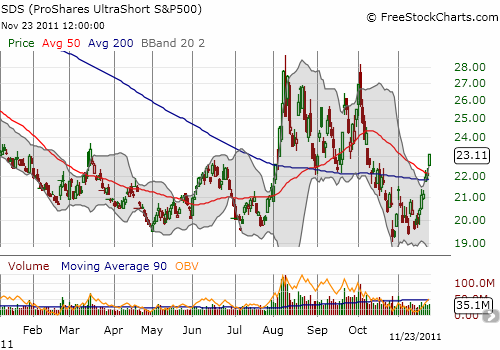
Supporting the bearish outlook is a breakout of SDS, the ProShares Ultrashort S&P 500, above its 50DMA.

Here is a summary of potential scenarios and how I will be trading them:
- Fade rallies, especially upon a retest of the 50DMA resistance.
- Buy T2108 oversold but not aggressively. Aggressive buying will make the most sense once the volatility index (VIX) experiences large upward moves again.
- Invalidate the current bearish forecast with a close above the 50DMA. However, such a move does NOT revive the previous bullish forecast. Only a close above the 200DMA and then the October high will re-introduce a bullish outlook.
In the meantime, I continue to close out (slowly!) bearish positions. I am still holding the bulk of my SDS shares. I will dump them all once T2108 goes oversold. New bullish positions will focus on the indices, particularly SSO (Pro Shares Ultra S&P 500) and EWG (Germany ETF). I may go long VXX upon a retest of the 50DMA, but I will not be interested in VXX puts until T2108 has spends a significant amount of time in oversold territory. Stay tuned on all these potential trades.
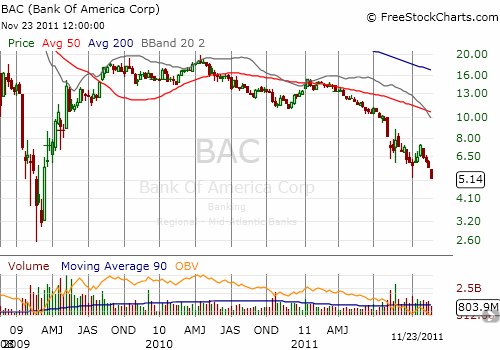
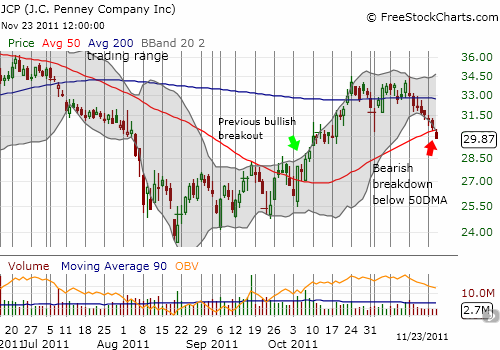
Finally, key individual stocks continue to reveal fundamental weakness in the market. Today’s charts are Bank of America (BAC), which closed at a new 32-month low, and J.C. Penney Company (JCP), which broke down below its 50DMA and invalidated the earlier bullish breakout.

Nightly Business Report interviews retail analyst John Long about holiday shopping, including a trip to J.C. Penney and Target (TGT) and a visit with Games Stop (GME) CEO Paul Raines. The overall commentary is laced with bullishness. Start video at 6:30.
Charts below are the latest snapshots of T2108 (and the S&P 500)
Refresh browser if the charts are the same as the last T2108 update.
Black line: T2108 (measured on the right); Green line: S&P 500 (for comparative purposes)
Weekly T2108

*All charts created using freestockcharts.com unless otherwise stated
Related links:
The T2108 Resource Page
Expanded daily chart of T2108 versus the S&P 500
Expanded weekly chart of T2108
Be careful out there!
Full disclosure: long SDS


Hey Doc, please explain the rationale behind the #2 scenario. Seems to ignore/conradict the general rules about when to buy T2108 (when it enters or when it exits). Thanks.
I am not sure how it contradicts. Scenario #2 says follow the rule to buy T2108 once it goes oversold (the aggressive strategy), but plan for a high likelihood of much more downside. For example, if you want to establish a 100 share position in SSO, start with 50 instead. The next buying point should come with the volatility index making a large upward move. Not a necessary condition, but sufficient. If T2108 is oversold for its typical one or two days, I would then recommend selling SSO on the next rally or at least by a retest of the 50DMA on the S&P 500.
I don’t use the conservative strategy for playing T2108, and have not thought through whether it requires any scenario planning.