(T2108 measures the percentage of stocks trading above their respective 40-day moving averages [DMAs]. To learn more about it, see my T2108 Resource Page. You can follow real-time T2108 commentary on twitter using the #T2108 hashtag. T2108-related trades and other trades are posted on twitter using the #120trade hashtag)
T2108 Status: 70% (thirteenth day of the overbought period)
VIX Status: 36
General (Short-term) Trading Call: Hold
Commentary
I never finished a T2108 Update I tried to write for Tuesday, November 8. It is just as well! I gave it the subtext “When Will the Overbought Period End?” and I drew out several scenarios. On Wednesday, Nov 9, T2108 dropped exactly to 70.00%. That’s right, EXACTLY on the edge of the overbought period.
Wednesday’s trading action was a perfect reminder of just how fast an overbought period can come to a sudden end; in one day, T2108 went from extremely overbought at 85% to the edge. The trading action was also a great reminder of why I strongly advise against initiating new trading positions during overbought periods. Not only can the inevitable sell-off deliver quick losses, but the trader also then faces the nervous prospect of wondering just how far the sell-off could last. After all, technically, risk exists all the way back down to oversold territory (T2108 at 20% or lower).
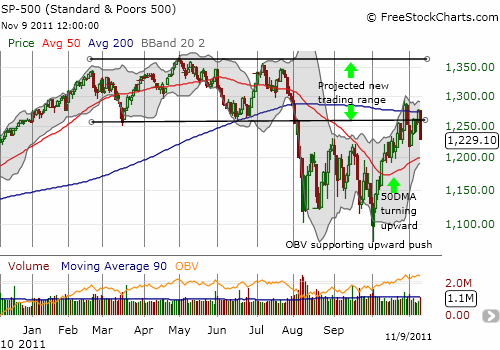
For now, I am still targeting the 50DMA as the lower bound for the S&P 500’s drop from overbought territory. With the index losing 3.7% in one day, it has now dropped BELOW the open on October 24 when T2108 first closed in overbought territory. The chart below shows how the 200DMA rejected the S&P 500 just as it had finally repositioned itself in the higher trading range.

Source: FreeStockCharts.com
The current loss of 2% for this overbought period places this period at the extremes of historical performance. My analysis shows that only 7% of all overbought periods (since 1986) have performed as badly or worse than this one. Ironically, as of yesterday, the extreme I was considering for this period was one of duration not of negative performance.
The stock market’s ability to levitate in this overbought period has been impressive. However, over the 13 days that T2108 has remained overbought, the S&P 500 printed a maximum closing gain of 2.9%. This performance is quite typical as a breakout to larger gains in an overbought period does not typically begin until after 20-30 days (see historical analysis). In fact, the LARGEST gain on the S&P 500 for all overbought periods lasting 20 days or less is only about 4%. This is truly a high risk/low reward setup for bullish positions.
Note that T2108 is already well over the average and the median durations for an overbought period. 81% of all overbought periods have ended by 14 days; 88% by 19 days; and 94% by 25 days. After this point, the likelihood rapidly increases for the S&P 500 to jump past 5% in gains measured from the close of the first day of the oversold period.
I find it interesting to note that hitting the upper part of trading range would represent a 10% gain and would mark a HIGH likelihood of maximum gains for the overbought period. Only 5% of all overbought periods have performed better at their points of maximum return.
Now how about the time it takes to return to an overbought period? The historical analysis shows that the average is 31 days but the median is 7 days. In other words, in a bull market or upswing, traders do not have long to consider whether or not to bias trades toward the bullish side. A successful retest of the upward sloping 50DAMA for the S&P 500 would definitely represent one of those strong periods with brief interludes between overbought periods.
Now, on to volatility. I am clearly going to lose my battle with VXX this month. The volatility-related index soared 19% and is right on the edge of violating the bearish pattern I pointed out just last week. Although I have held SDS all this time, I learned a great lesson and reminder in taking profits on positions that are meant to be short-term. I am fine with doubling down since, at the time, if I had no position in VXX puts, I would have bought some.
I end with a quick look at my trio of “euro panic” plays. All three, EWG (iShares MSCI Germany Index Fund), SI (Siemens), and DB (Deutsche Bank) all sold off heavily (-7%, -7%, and 11%) and are at or near their respective 50DMAs. I was tempted to buy, but I decided to stick strictly to the “no buy” rule on short-term trades for T2108 overbought. Starting with EWG, I should be buying by week’s end.
Charts below are the latest snapshots of T2108 (and the S&P 500)
Refresh browser if the charts are the same as the last T2108 update.
Black line: T2108 (measured on the right); Green line: S&P 500 (for comparative purposes)
Weekly T2108

*All charts created using freestockcharts.com unless otherwise stated
Related links:
The T2108 Resource Page
Expanded daily chart of T2108 versus the S&P 500
Expanded weekly chart of T2108
Be careful out there!
Full disclosure: long SDS, long puts on VXX


Very nice; focused on the important points, well written, sobering, reinforcing of what I have learned from you and the rules.
Graci
As always, thanks for the great feedback!