(T2108 measures the percentage of stocks trading above their respective 40-day moving averages [DMAs]. To learn more about it, see my T2108 Resource Page. You can follow real-time T2108 commentary on twitter using the #T2108 hashtag. T2108-related trades and other trades are posted on twitter using the #120trade hashtag)
T2108 Status: 84% (ninth day of overbought period)
VIX Status: 30.5
General (Short-term) Trading Call: Hold
Commentary
For the ninth straight day, T2108 closed in overbought territory. At 84%, T2108 is again at extremes. I have updated my historical analysis of overbought periods (I hope to publish it by next week) and found that the average overbought period lasts 9 days while the median for overbought periods rests at 4 days. 70% of all overbought periods last 9 days or LESS. Also note that returns during overbought periods are strongly correlated with the duration of the overbought period. Unless the stock market experiences a vicious sell-off tomorrow, this overbought period will be well on its way to historical extremes. I am quite surprised that T2108 is even at this point given the strong two days of selling on Monday and Tuesday. Yet another testament to the bullish undertones to the market.
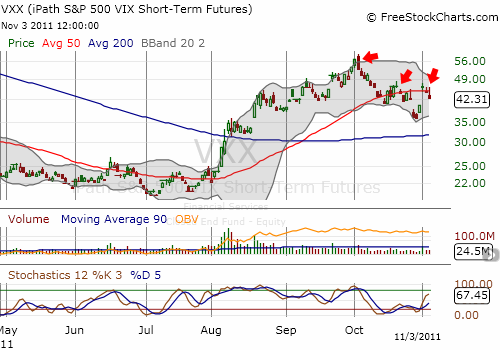
Accordingly, measures of volatility are quickly coming down again. The VIX is back to 30.5, the approximate floor of the previous trading range. VXX is back below its 50DMA. Given its failure at resistance, VXX is still in the midst of a very bearish setup. As I mentioned in the last T2108 update, it hurt to watch my profits on the VXX puts turn into a loss, but the overall bearish outlook for VXX compelled me to double down. So far, so good on that move. The arrows in the chart below point to the bearish patterns that are confirming lower levels ahead. I have written earlier about the first two arrows (bearish engulfing and an evening star confirmed with a breakdown below the 50DMA). The third arrow is latest breakdown featuring a failure to break resistance from the previous breakdown.

Source: FreeStockCharts.com
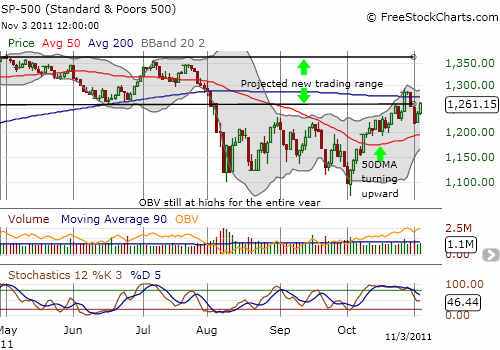
The S&P 500 gained 1.9%. At 1261, the index closed a hair above the floor for the higher trading range I keep pointing out. As the 50DMA continues creeping upward, the projected downside for this rally continues to shrink. Headline news continues to churn the market providing alternate bouts of euphoria and despair. Focusing on the overall picture helps us ignore all that.

Today, I sold more of what I am now calling my “euro panic” positions. I sold Deutsche Bank (DB) shares yesterday, and I sold EWG shares and Siemens Atkins (SI) calls today. I now only have DB calls remaining. As I tweeted earlier today, buying these positions during an overbought period was very unorthodox (meaning fraught with a lot of risk), so my holding periods were necessarily short. However, I am now keenly focused on European-based buying opportunities that result from the various bouts of panic about economic and debt conditions there. More specifically, I am particularly interested in buying Germany “on the cheap.”
Charts below are the latest snapshots of T2108 (and the S&P 500)
Refresh browser if the charts are the same as the last T2108 update.
Black line: T2108 (measured on the right); Green line: S&P 500 (for comparative purposes)
Weekly T2108

*All charts created using freestockcharts.com unless otherwise stated
Related links:
The T2108 Resource Page
Expanded daily chart of T2108 versus the S&P 500
Expanded weekly chart of T2108
Be careful out there!
Full disclosure: long SDS, long puts on VXX, long DB calls

