Goldman Sachs (GS) is the company everyone loves to hate. This sentiment makes a potential bottom in the stock, potentially explosive.
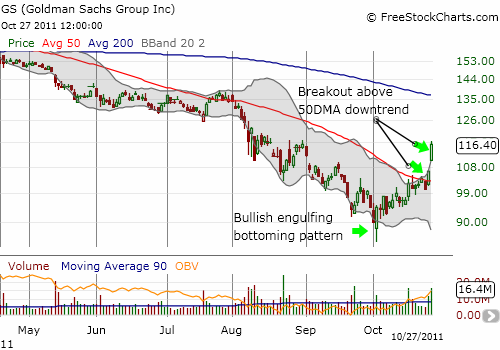
Since mid-September, buying volume in GS has significantly dominated selling volume. In the past 2 days, GS has gained 16%, producing a very strong breakout above the downtrend formed by a declining 50DMA. I interpret this strength as a convincing sign that buying interest will keep GS aloft for a considerable time.

Source: FreeStockCharts.com
Of course, the rapidly declining 200DMA will serve as tough level of resistance. That level now coincides the trading range GS printed in the middle of the year. Combined, these resistance levels should provide stiff resistance. But let’s take this one step at a time.
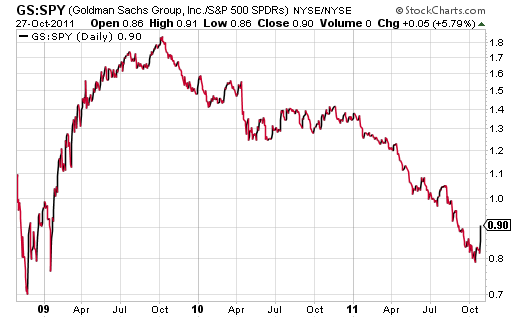
Perhaps most telling is that since GS nearly reached its March 2009 lows relative to the S&P 500 several days ago, the stock has bounced sharply. This suggests lower prices are getting firmly reject and a bottoming process is finally underway.

Source: GS vs SPY, last 3 years
When the stock hit two-year lows relative to the S&P 500, I concluded:
“It is not clear to me whether this relationship is anything more than a technical oddity, but I am fascinated nonetheless. It seems to me that either GS is very undervalued (relatively) or GS’s decline is like a clock slowly ticking away time for the general market.”
Given GS peaked in October, 2009, within months of the S&P 500 March, 2009 lows, and the stock bottomed in the Fall of 2008, ahead of the market’s bottom, I am now back to thinking of GS as a potential leading indicator.
Be careful out there!
Full disclosure: long GS
