(T2108 measures the percentage of stocks trading above their respective 40-day moving averages [DMAs]. To learn more about it, see my T2108 Resource Page. You can follow real-time T2108 commentary on twitter using the #T2108 hashtag. T2108-related trades and other trades are posted on twitter using the #120trade hashtag)
T2108 Status: 85% (fourth day of overbought period and a new 52-week high)
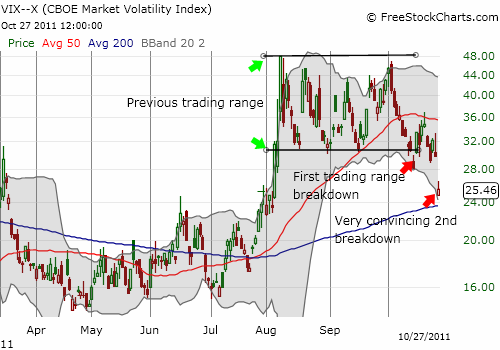
VIX Status: 25 (“decisive” breakdown from the previous trading range)
General (Short-term) Trading Call: Continue closing out bullish trades, start opening bearish trades. Do not get aggressive with shorts. More details below.
Commentary
Thursday’s close exceeded my expectations. The 200DMA has served as my upper resistance target for the S&P 500 for an overbought T2108. Now, T2108 is extremely overbought at 85%, and the S&P 500 is 10 points above its 200DMA. While I still expect the S&P 500 to work off overbought conditions with a gradual pullback to the now bullishly rising 50DMA, today’s trading action further convinces me that the S&P 500 is headed for a higher trading range. This trading range will feature the previous 2011 lows as the floor (around the 200DMA as well now) and current 52-week highs as the ceiling. At 1284, the S&P 500 is already ABOVE the previous 2011 lows around 1262.
All the bullish signals I have been following continue to support higher prices. Volatility is sure to decline even more rapidly now, especially with the “bad” months of September and October behind us. The charts below show the VIX convincingly tumbling from its stubborn trading range. Next support is at the 200DMA, but this should not last long.

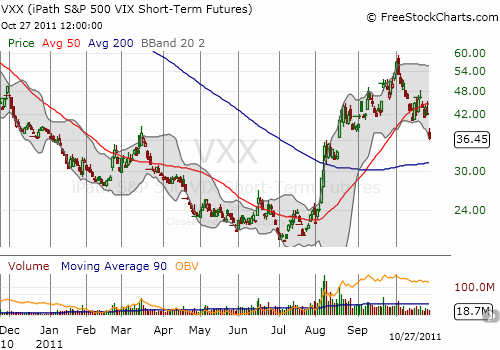
Similarly, VXX is well on its way to resuming its normal downtrend. It is now at 2 month lows; its uptrend decisively broken. (See previous T2108 post from October 24, 2011 for a summary of the bearish features of this chart.)

Despite my increasing bullishness, I have to remember that “rules are rules.” An overbought T2108 is a time for selling. I realize that making the mental switch is difficult after building up the mental and emotional stamina to remain bullish through that last four months of market churn and consternation. If I learn nothing else this year, I have to keep in mind that the T2108 rules have received major validation over and over this year (and even in 2010). For example, buying and holding SSO from the first oversold day during the past swoon generated a 12% gain by Thursday’s close (with a 14% maximum drawdown). An aggressive trader would have added to this position at lower prices to increase the reward/risk ratio. (I have written at length on how declining prices produce LESS downside risk than increasing prices, especially when T2108 is oversold versus when T2108 is overbought).
I spent a lot of time unloading bullish trading positions throughout the day. These sales included some stocks that are part of my “commodity crash” playbook. I will have an update on that in the coming weeks. I simply had no time to tweet the specifics. My biggest “darn” of this process was selling off all my SSO positions two days before this big move. Overbought periods typically last a lot longer than oversold periods, so I should not have rushed. The majority of oversold periods last no more than 2 days, while the average overbought period lasts 8.9 days (the media is 4.5 days). However, this year, overbought periods were very short and led to sharp pullbacks. I had that history in the back of my mind. Another lesson learned.
In addition to the sales, I added another small tranche of shares in SDS. I am not being aggressive with the bearish plays specifically because I am getting more bullish overall. The stock sales free up cash to buy the dips later. Going forward until further notice – like the S&P 500 closing below its 50DMA – the trading mantra will be to buy on the dips…when T2108 is not overbought of course.
Finally, I am still holding those VXX puts. They are finally paying off well now. As I mentioned above, I expect volatility to decline overall, and bearish positions on VXX should be a very profitable way to play the implosion of volatility. You can also sell puts on certain stocks during sell-offs, but this is more risky (see “CEO Hastings Wins Big As Netflix Continues Erasing Its Multi-Year Rally” for an idea I had on selling puts on NFLX).
Charts below are the latest snapshots of T2108 (and the S&P 500)
Refresh browser if the charts are the same as the last T2108 update.
Black line: T2108 (measured on the right); Green line: S&P 500 (for comparative purposes)
Weekly T2108

*All charts created using freestockcharts.com unless otherwise stated
Related links:
The T2108 Resource Page
Expanded daily chart of T2108 versus the S&P 500
Expanded weekly chart of T2108
Be careful out there!
Full disclosure: long SDS, long puts on VXX


Doctor, are you advocating buying on the dips before T2108 gets to oversold? I thought the rules were to wait til it becomes oversold.
Good catch. Difficult question. Waiting to trade T2108 extremes is a viable strategy, but if the market starts trending upward, waiting for T2108 getting oversold will have you sitting on the sidelines for a long time. I am suggesting that given the increasing bullishness of the market, the strategy changes from waiting for extremes to just avoiding making fresh buys when risks are highest (T2108 overbought). In my next T2108 update I will address this issue more carefully.