(T2108 measures the percentage of stocks trading above their respective 40-day moving averages [DMAs]. To learn more about it, see my T2108 Resource Page. You can follow real-time T2108 commentary on twitter using the #T2108 hashtag.)
T2108 Status: 61%
VIX Status: 28
General (Short-term) Trading Call: Close a few bullish positions in case trading range stays firm, otherwise hold. For more details, see below.
Commentary
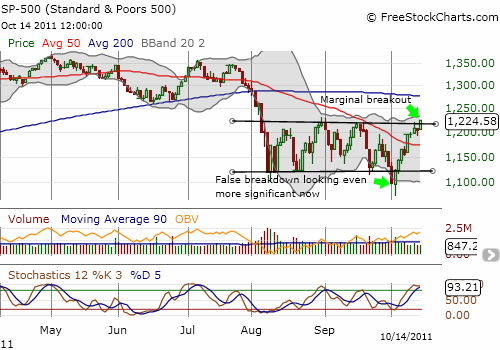
I have great news, and I have some words of caution. T2108 closed at 61% and is now almost at a three-month high. Great news. On July 25, when T2108 was last at current levels, the S&P 500 closed at 1337 and was right at the edge of its historic 2-week plunge into the second oversold period of the year. The great news here is that I believe this sets up a positive divergence where the index will play catch-up with T2108. On Friday, the S&P 500 closed at its high at 1225, a 2 1/2 month high that prints a marginal breakout from the previous trading range. The strong close is just what we want to see on a breakout. That is great news. The first word of caution is that this breakout is marginal and only puts the index a few points above the previous trading range. The index will need swift follow-through to generate a convincing breakout.

The chart of the S&P 500 contains some other interesting clues. Note well that stochastics are now overbought. At the top of a trading range, such stochastics are a bright red flag. However, while I expect some selling pressure to begin next week, the steady increase in on-balance volume, or OBV (the summation of up-volume and down-volume), demonstrates steady accumulation since the August lows. This very bullish upward trend is something I am noticing for the first time! If I had noticed it earlier, I would have been even more bullish than I was during the oversold periods. Now, I interpret this pattern to suggest that any pullback from overbought stochastics will be met with eager buying. Thus, I am sticking with my last forecast that T2108 will hit overbought levels before getting oversold again. I will assume the 50DMA will hold as firm support in the face of the next dip.
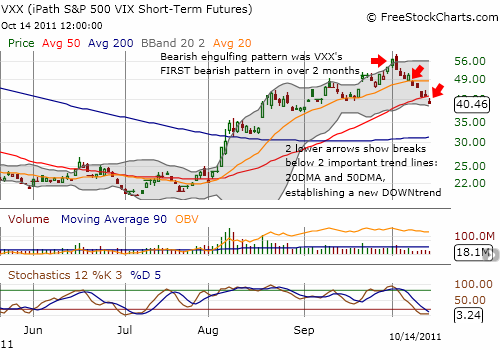
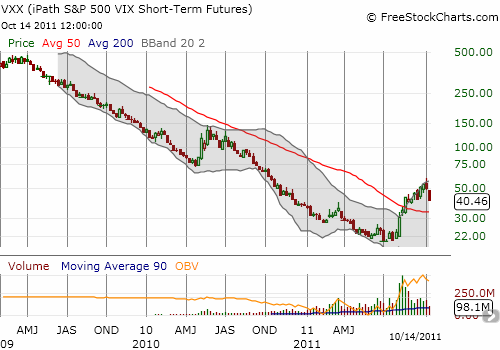
Ever since VXX, the iPath S&P 500 VIX Short-Term Futures, printed a bearish topping pattern on October 4th, I have been tracking volatility’s pattern ever more closely for bullish clues. VXX next broke its primary uptrend at the 20DMA and now it has broken down below the even more important 50DMA – great news. Even though VXX’s stochastics are now oversold (word of caution), I expect VXX to decline very rapidly from here. Sooner than later, this index should resume its more normal pattern of continual and consistent losses.


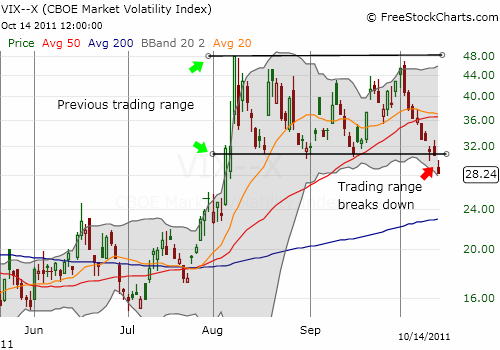
In parallel, the VIX, the volatility index has finally broken down below its trading range. This breakdown is a bit more convincing than the breakout of the S&P 500.

Even as I thought the market was getting more bullish, it was fascinating to read the opinions and observations of traders who thought the exact opposite. I think hedge fund manager Doug Kass makes for a particularly interesting case given he was very bullish at the market lows the prior week.
On October 5th, I added hedge fund manager Doug Kass as one of several bullish indicators when he tweeted that he had increased his recommended equity allocation from 65% to 70%. That day (Oct 4th) was a major bullish reversal that launched the current rally. Kass has now backed off his bullishness, as he clearly biases his trading toward a continuation of the trading range. He spent all of last week in a bearish mood even as the S&P 500 rose 6% from Monday’s (Oct 10) open to Friday’s (Oct 14) close. Here are his relevant tweets (as-is) over the course of the week listed in chronological order:
Oct 10
- I shorted soem Spiders at 117.60 to balance out my long stock book . Outsized rreaction to Euro news.
- If Sunday’s Eurozone deal was so great – why, I ask, are the European bourses’ rally so tepid???
- I shorted some more Spyders at 118.9 – to put me in a slightlynet short position.
- I am ending the day slightly net short and I feel “relatively” comfortbable there.
Oct 11
- On RealMoney Pro – I am taking down my long exposure in Kass Model Portfolio from 70% to 50% now
- I added to my Spyder short at 119.3 just now.
Oct 12
- one thing that should give the bulls some pause is that the qqq has been relatively flat all day after the early spike..
- another potential near term concern is that apple is trading at the days low now
- take a look at intraday charts of qqq and apple on realmoneypro that i just posted. the relative weakness – s term headwinds for market.
Oct 13
- Redness
The S&P 500 rallied back from its losses on Thursday, Oct 13th. The index quickly painted over the “redness,” changing to major green the next day. Kass provided no market-related tweets as the market rallied strongly. I can only assume he is gathering his thoughts as he finds himself more bearish than he has been in a while. Note well that dropping recommended equity exposure from 70% to 50% in one day – as the S&P 500 struggled to hit 1200 – is a major move. In parallel with the increasing shorts on the S&P 500, Kass is essentially betting that the trading range will hold firm. As the market works off its overbought stochastics, I am sure he will tweet his vindication.
However, if a bull (or at least non-bear) like Kass can so quickly move against the market at the top of the previous trading range, imagine what the true bears have done ever since assuming the fresh 52-week lows on October 4th signaled the beginning of a lasting bear market and a quick tumble to 1000? The bears have PLENTY of fundamental reasons to explain and expect lower stock prices. They are now caught leaning the wrong way in a major way. A follow-through on the current breakout should swiftly take the S&P 500 to the 200DMA resistance on short-covering and the buying of anyone who feels “the train is leaving the station.” For example, rising prices are helping to push investor sentiment upward: “Investor Sentiment Rises For Third Straight Week” (hat tip to @StockJockey for the link).
My trading call in this post recognizes there is a high enough probability that the trading range holds to warrant taking some profits here. For example, I finally sold my “euro-bounce” play EWG, the iShares MSCI Germany Index Fund, even as it continues along its impressive breakout. I tweeted the trade and indicated that EWG is a buy on dips. I also bought October calls on VXX assuming that if the trading range holds firm, this event will generate a sharp (and brief) increase in volatility. However, overall, I remain focused on T2108 hitting overbought levels before backing off my bullishness. Even if the process takes some time, volatility will likely plummet along the way. Accordingly, I bought November puts on VXX (twice the number of Oct calls).
Taken all together, the bullish indicators that have grown for two trading weeks continue to converge on a major breakout. It is too bad T2108 is also approaching overbought status, but, as always, I will evaluate the T2108 trades one step at a time.
Charts below are the latest snapshots of T2108 (and the S&P 500)
Refresh browser if the charts are the same as the last T2108 update.
Black line: T2108 (measured on the right); Green line: S&P 500 (for comparative purposes)
Weekly T2108

*T2108 charts created using freestockcharts.com
Related links:
The T2108 Resource Page
Expanded daily chart of T2108 versus the S&P 500
Expanded weekly chart of T2108
Be careful out there!
Full disclosure: long SSO, long puts and calls on VXX


Doctor,
Have admired your work for a long time. As you, I pay attention to Kass and in fact use the two of you as the most influential opinions I read. He makes his share of bad calls, so I hope you don’t put two much emphasis on what he thinks. Your 10 column inches devoted to Kass makes me worry. I’d like to keep using two INDEPENDENT opinions.
Regards,
Joe
Point taken! I use Kass as one of many data points. I certainly admire him for his courageous and bold analysis. Note that I did not share his bearishness last week. I am definitely independent. I am also not trying to call out a wrong call – it’s part of the business of prognostication. I only meant to highlight the likely psychology of true bears who likely are getting a bit antsy here.
Thanks again for the feedback.