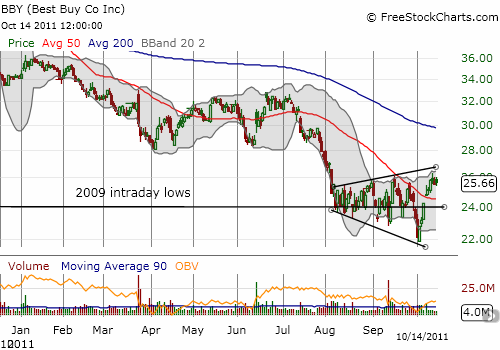
The saga of Best Buy’s bottom has now developed in a strange fashion.
For two months now, I have maintained a laser focus on the buying opportunity in Best Buy (BBY) stock based on some stabilization around the 2009 lows. In the last post, I pointed out that sellers may have finally been washed out after earnings. Three weeks later, BBY plunged to fresh 52-week lows and prices last seen almost three years ago. This move was in sympathy with the S&P 500 which printed fresh 52-week lows on the same day. However, since that point, BBY has raced upward 17% and now sits at recent highs.
These moves have formed what I now recognize as both lower lows and higher highs, a widening wedge. The technical interpretation of this pattern is not clear.

Source: FreeStockCharts.com
To me, the widening range of Best Buy represents an increasingly intense battle between bears and bulls: bears show their mettle by forcing the stock to new multi-year lows and then bulls show their own mettle by sending the stock to a rapid recovery and new highs in the widening wedge. While the bulls still need to tag the upper part of this wedge, they at least have the 50-day moving average (DMA) developing in their favor. The stock has broken out above this important technical line; the 50DMA even looks like it will be turning upward soon. If BBY can hold firm there with a successful retest, and, even better, around the 2009 intra-day lows, I will once again get more confident in the formation of a lasting bottom.
Full disclosure: long BBY
