(T2108 measures the percentage of stocks trading above their respective 40-day moving averages [DMAs]. To learn more about it, see my T2108 Resource Page. You can follow real-time T2108 commentary on twitter using the #T2108 hashtag.)
T2108 Status: 22% (2nd day of oversold conditions)
VIX Status: 36
General (Short-term) Trading Call: Hold.
Commentary
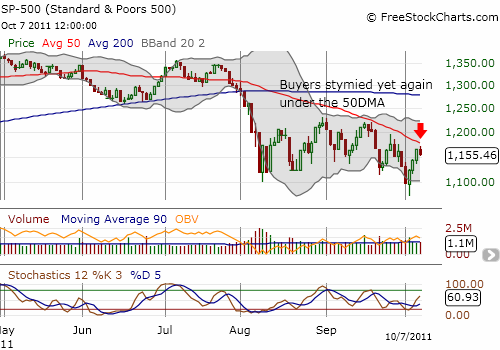
T2108 dropped a surprisingly large 5 percentage points to 22% while the S&P 500 only fell 0.8%. What looked like and felt like a boring day could be deceptive. As I have stated before, as long as the S&P 500 remains within its trading range, we learn little new information. However, today, the index failed yet again at the declining resistance of the 50DMA.

I am guessing that we are set-up now to retest the lower part of the previous trading range. I am also guessing that this retest will succeed given the convergence of bullish signals that helped drive the index out of an otherwise dangerous breakdown below the trading range.
Although the VIX dropped slightly, VXX remains as stubborn as ever. The volatility index ETN delivered a nice follow-through on a bearish topping pattern over the past three days, but today (Friday), it stopped neatly on top of the 20DMA which has perfectly defined the uptrend since VXX broke out in early August. I am still waiting for this index to break down to give me a strong bullish signal. VXX’s refusal to break down below the upward-pointing trendline supports my guess that another leg downward is coming for the S&P 500. Without knowing what was coming, I closed out my VXX puts near the open, mainly because it did not drop as far as I thought it should given the relatively bullish open and strong overseas markets (I tweeted this trade here).
As described in my latest update on the “commodities crash playbook,” I decided to rebuild a short position in Caterpillar (CAT). This position is a hedge on various commodity-related stocks that I own; it is not a bet on further downside. Note however that CAT setup perfectly for a short, dropping 2% after failing to break above a declining 20DMA (click the link to see the chart). The candlestick pattern is another classic bearish signal called a “dark cloud cover.”
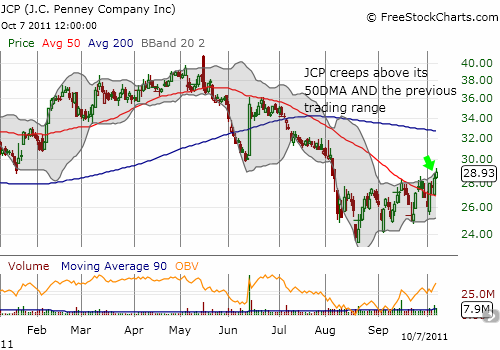
I will end on a positive note with the chart of JC Penney Company, Inc. (JCP). JCP is definitely not important enough to be a market indicator, but its behavior this week is exactly what I want to see when ascertaining whether sentiment is shifting out of negative gear. JCP lowered earnings guidance and was down as much as 5% in pre-market action on Thursday. The stock quickly turned around and is now continuing along its constructive creep above its 50DMA. JCP is even trading ABOVE its previous trading range. This stock is one to watch for anyone who wants to make a bullish bet on a recovery in the retail space.

Charts below are the latest snapshots of T2108 (and the S&P 500)
Refresh browser if the charts are the same as the last T2108 update.
Black line: T2108 (measured on the right); Green line: S&P 500 (for comparative purposes)
Weekly T2108

*T2108 charts created using freestockcharts.com
Related links:
The T2108 Resource Page
Expanded daily chart of T2108 versus the S&P 500
Expanded weekly chart of T2108
Be careful out there!
Full disclosure: long SSO, long CAT puts

