(T2108 measures the percentage of stocks trading above their respective 40-day moving averages [DMAs]. To learn more about it, see my T2108 Resource Page. You can follow real-time T2108 commentary on twitter using the #T2108 hashtag.)
T2108 Status: 23% (ends last oversold period at 2 days)
VIX Status: 41
General (Short-term) Trading Call: Hold
Commentary
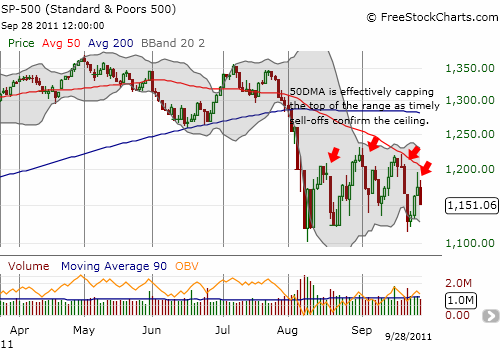
T2108 plunged almost 10 percentage points back to the edge of oversold territory. The S&P 500‘s 2% loss formed a classic bout of follow-through selling from a failed test of resistance. This is the fourth such move since the trading range began and simply confirms yet again the strength of this range.

The chart above shows how well the 50DMA has defined the top of the trading range. With the 50DMA rapidly trending downward, the market is likely going to make an important move soon. If the 50DMA’s stiff resistance continues, the S&P 500 will be shoved into new 2011 lows and a breakdown below the trading range. If instead the S&P 500 breaks above this resistance in the next two weeks or so, the index should finally experience a sustained rally.
Note that Wednesday’s sell-off stops out the conservative trader who waited for an exit from oversold territory to buy (reminder: the conservative trader is focused on minimizing downside risks). I will continue to choose the aggressive strategy if T2108 goes oversold with a small position in SSO and building on increasing VIX values. The VIX is, of course, back to the top of its trading range.
T2108 has now dropped into oversold territory three times in three months. A fourth drop so soon will further increase the probability of an extended bear market. One of my lessons from observing T2108 in the final years of the last bear market was that an increasing frequency of oversold periods seems to be a bearish indicator. I cannot yet discern whether what happened was a coincidence, but it seems the current market action is creating another data point for testing this conclusion.
Caterpillar (CAT) also suffered from follow-though selling. More importantly, it is close to a retest of the new 2011 low set last week. As a reminder, I am following CAT more closely as a potential indicator of the market’s mood regarding the economy and, by extension, the general stock market. (I am NOT using CAT as a trading signal, just additional context – confirmation or invalidation. Recall that I earlier learned from trying to use AAPL as a general trading indicator that it is better to stick with T2108’s rules.)
In other words, given all the above observations, the stock market’s trading range is reaching a critical juncture suggesting the range will not last much longer…for better or for worse.
Charts below are the latest snapshots of T2108 (and the S&P 500)
Refresh browser if the charts are the same as the last T2108 update.
Black line: T2108 (measured on the right); Green line: S&P 500 (for comparative purposes)
Weekly T2108

*T2108 charts created using freestockcharts.com
Related links:
The T2108 Resource Page
Expanded daily chart of T2108 versus the S&P 500
Expanded weekly chart of T2108
Be careful out there!
Full disclosure: long SSO

