(T2108 measures the percentage of stocks trading above their respective 40-day moving averages [DMAs]. To learn more about it, see my T2108 Resource Page. You can follow real-time T2108 commentary on twitter using the #T2108 hashtag.)
T2108 Status: 14% (Day #11 of the current oversold period).
VIX Status: 43
General (Short-term) Trading Call: Only add to bullish positions on dips. Hold any remaining bearish positions as small hedges.
Commentary
Ouch. When the stock market erased its losses from last week, I mentioned that determining exit criteria for short-term bullish trades presented us with a mental challenge. I did not anticipate a complete mental meltdown for the stock market BEFORE T2108 exited the oversold period.
Thursday, the market reminded us that bearish sentiment still weighs heavily on the market as the S&P 500 cratered 4.5%. The VIX soared to 43% (VXX gained 21%). T2108 dropped from 19% to 14%. I find it particularly ironic that I noted yesterday’s bearish warnings but chose to largely ignore them because of current oversold conditions. I was even thinking the VIX would not bounce until hitting 30 first, providing just enough room for T2108 to finally exit oversold conditions. Almost any other time, I might have picked from a broad basket of bearish trades. Instead, I picked just one short that seemed to offer acceptable upside risk (XLV) given my bullish bias. The pervasive carnage in the market demonstrates that I could have thrown darts and succeeded. The only good news is that the S&P 500 managed to hold 2011 lows and stay out of bear market territory (click here for a chart).
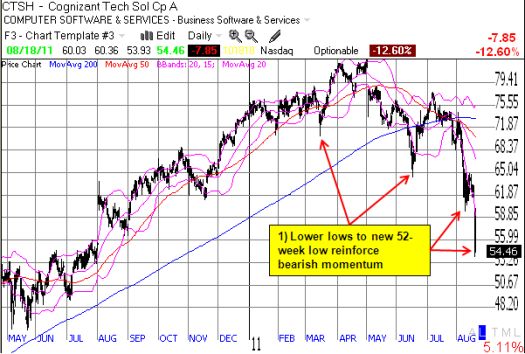
I am now concerned with the increasing number of stocks that are breaking their 2011 lows and even March, 2009 lows. A stock like Cognizant Technology (CTSH) looks ready to begin a fresh selling streak as Thursday’s 13% drop to a new 52-week low came out of a period of consolidation. Stocks like these are important to watch because they have received strong sponsorship and institutional buy-in up until now.

After seeing a good number of charts like CTSH’s, I decided to ignore my growing sense of greed looking at all these “bargains” and instead kept my powder (mostly) dry (I did add a small number of shares in Petroleo Brasileiro S.A. Petrobras (PBR) as part of the commodities crash playbook). I want to see how the stock market behaves as it hovers above and/or approaches last week’s lows. The new challenge at this juncture is that the stock market may have begun a new oversold cycle without ever having left the first one. It is a matter of mere chance that Thursday’s sell-off occurred with T2108 at 19% and on the edge of the oversold period. This interpretation implies that there is a growing, yet still small, chance for last week’s lows to break.
At 11 days long, this oversold cycle is now one of the longest since 1987. Only nine of the 52 (17%) oversold periods since 1987 have been as long or longer (correction to stats noted earlier): 1987 – 41 days, 1990 – 13 days, 1998 – 12 days, 2002 – 12 days, 2004 – 11 days, 2008 – 16, 26 and 15 days (although only one day separate the last two oversold periods), and 2009 – 15 days. In other words, yes, this oversold period is extreme, but it can still last longer. If this oversold period lasts another few days, I will assume we are essentially in bear market territory even if the S&P 500 does not close with a 20% loss from the 52-week high.
If you chose the aggressive trading approach during this oversold period, hopefully you also followed my advice to lock in some profits, granted the end of the oversold period was supposed to be the biggest signal to take some profits. If you chose the more conservative approach, you either are still waiting for the signal to buy (the exit from the oversold period) or you only have a small and manageable set of trades active from the second oversold day. Either way, you should continue to respect the bearish sentiment and manage risks accordingly. If you choose to chase stocks down with bearish positions (NOT my recommendation), just remember that an oversold period is fraught with high risks for shorts and sharp snapback rallies are a constant “threat.”
I am very interested to hear how you have been managing short-term trades in this environment. Share your thoughts, strategy recommendations, critiques, etc. by leaving comments. You can also email me directly.
Charts below are the latest snapshots of T2108 (and the S&P 500)
Refresh browser if the charts are the same as the last T2108 update.
Daily T2108 vs the S&P 500

Black line: T2108 (measured on the right); Red line: S&P 500 (for comparative purposes)
Weekly T2108

*All charts created using TeleChart:

Related links:
The T2108 Resource Page
Expanded daily chart of T2108 versus the S&P 500
Expanded weekly chart of T2108
Be careful out there!
Full disclosure: long shares and calls on SSO, long VXX puts
