(T2108 measures the percentage of stocks trading above their respective 40-day moving averages [DMAs]. To learn more about it, see my T2108 Resource Page. You can follow real-time T2108 commentary on twitter using the #T2108 hashtag.)
T2108 Status: 19% (Day #10 of the current oversold period).
VIX Status: 32
General (Short-term) Trading Call: Only add to bullish positions on dips. Hold any remaining bearish positions as small hedges.
Commentary
T2108 is now in the 90th percentile of all oversold periods since 1987. At 19%, it gained two percentage points and had a better showing than I would have expected on a day where the S&P 500 was essentially flat. This is not quite a bullish divergence, but it appears some stocks are trying to lead the market out of this oversold period. On the other hand, two things have me worried:
The VIX (the volatility index), remains resilient.
The VIX looks like it wants to bounce off the 30 level which is the 20DMA. Its downward momentum has nearly evaporated (click here for the chart). Moreover, the VXX, an ETF for VIX short-term futures, has simply churned for eight straight trading days. This pattern is starting to look like consolidation before another rally (click here for the chart).
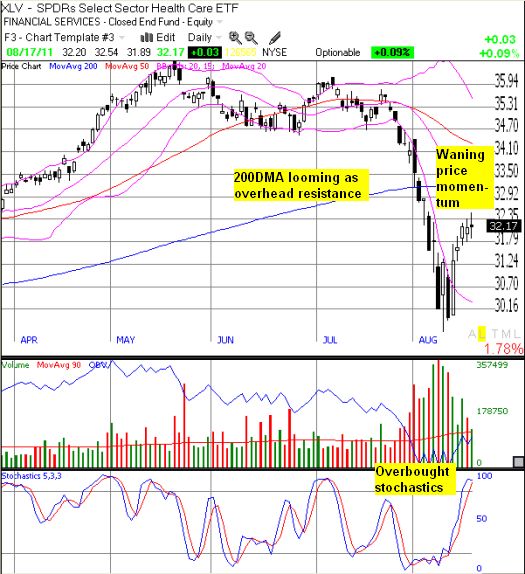
Too many stocks exhibit waning momentum. Many of the patterns I am seeing are actually classic bearish set-ups (admittedly, this is a VERY informal statement!). Since T2108 is oversold, I am not interested in chasing these down. However, ONE chart I could not resist: XLV, the SPDRs Select Sector Health Care ETF. Technically, I should have waited for a previous day’s lows to break as a bearish confirmation, but the flattening 200DMA looming overhead looks like it will provide firm resistance in case the rally continues to inch along.

Given the mix of bearish technicals that I see, the short-term trading call will likely retain a recommendation for maintaining a small bearish position for hedging against downside risks. It also makes sense to lock in profits a little more aggressively to free up cash for the next dip.
Charts below are the latest snapshots of T2108 (and the S&P 500)
Refresh browser if the charts are the same as the last T2108 update.
Daily T2108 vs the S&P 500

Black line: T2108 (measured on the right); Red line: S&P 500 (for comparative purposes)
Weekly T2108

*All charts created using TeleChart:

Related links:
The T2108 Resource Page
Expanded daily chart of T2108 versus the S&P 500
Expanded weekly chart of T2108
Be careful out there!
Full disclosure: long shares and calls on SSO, long VXX puts
