(T2108 measures the percentage of stocks trading above their respective 40-day moving averages [DMAs]. To learn more about it, see my T2108 Resource Page. You can follow real-time T2108 commentary on twitter using the #T2108 hashtag.)
T2108 Status: 13% (Day #7 of the current oversold period).
VIX Status: 36
General (Short-term) Trading Call: Only add to bullish positions on dips. Hold any remaining bearish positions as small hedges.
Commentary
T2108 increased slightly from 11% to 13%. At the current pace, T2108 is on track to exit oversold territory sometime in the next week. Of course, we should not expect a steady pace.
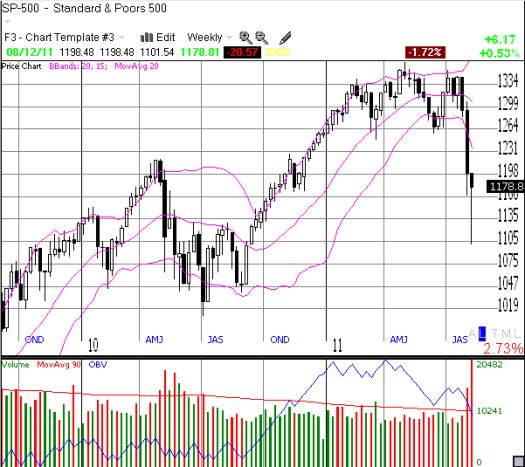
The S&P 500 did not make it to flatline for the week as I suspected it might. The index did close at its highest level for the week with a 0.5% gain. The weekly chart below shows how the market eliminated nearly a year’s worth of gains in less than three weeks.

This chart will mark a good point of reference for future trading. It clearly shows how the market churned in 2011 trading approximately between 1250 and 1350. The first point of major resistance for any future rallies will be the 1250 level where a lot of relieved sellers should consistently appear. Even after that selling gets exhausted, the S&P 500 could spend a lot more time churning between 1250 and 1350 again. In other words, T2108 should continue to signal many important bullish and bearish trading opportunities for some time to come.
While sneaking a peak at CNBC last week, I caught the infamous Jim Cramer expressing pessimism about the market because the up days gain less than the down days lose. This was a strange observation to make given the paucity of data points: the S&P 500 has closed with gains only 4 of the last 15 trading days – 3 of those days came in just the last week. While Carmer was certainly focused on the Dow Jones Industrials, the S&P 500’s registered two up days featuring point gains equal to the loss seen during the -4.4% performance on Wednesday. I realize many off-hand, poorly researched remarks spill in the heat of battle on television, but I point to this episode as one of many examples of how negative images can weigh on the psyche much more heavily than positive ones. This sentiment is also understandable given the stock market’s uncanny ability to wipe out weeks of gains in days and months of gains in weeks (again, just look at the above chart).
The biggest lesson traders should take from last week is that the stock market reached historic extremes in oversold readings. Tuesday’s intraday low just nicked official bear market territory for the S&P 500 (20% correction from the highs); I suspect it is no accident that point represented a low for the week. As a reminder, Monday’s T2108 closing reading of a mere 6.5% was last seen during the March, 2009 lows. Since 1987, there have only been 48 trading days where T2108 has been lower. Twenty-two of these days were during the October, 1987 crash; twenty-one of these days were during the panic of 2008; only THREE of these days were around the March, 2009 epic lows. The last two of these days were during a sell-off in August, 1990. The most common characteristic across these periods? These extreme periods of selling eventually gave way to large gains.
This month’s selling puts the stock market right on schedule for an eerie rerun of 2007-2008. The S&P 500 hit a major low in mid-August of 2007 and rallied strongly into October. 2007 was a year before a Presidential election. The unfortunate implication is that we may also expect a more sustained bear market by late 2012. Just something to keep in the back of our minds – See “T2107 Flashes A Major Bearish Warning” for a more detailed discussion. Until then, we will continue to take trading one T2108 cycle at a time.
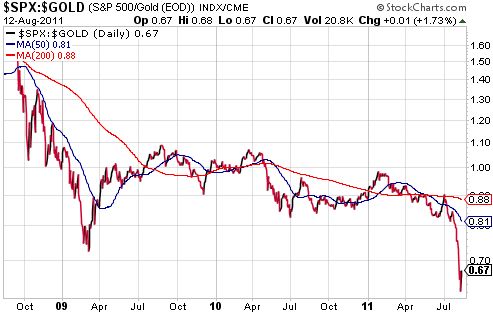
Finally, the S&P 500 hit an important milestone over the past week. When priced in gold, the S&P 500 broke below its March, 2009 lows.

Source: stockcharts.com
In other words, gold continues to be a much more effective store of value than the stock market (also see “Priced In Gold, the Stock Market Continues to Struggle” for more data). One more thing to think about when considering “long-term” investing in a world of rolling financial crises.
Charts below are the latest snapshots of T2108 (and the S&P 500)
Refresh browser if the charts are the same as the last T2108 update.
Daily T2108 vs the S&P 500

Black line: T2108 (measured on the right); Red line: S&P 500 (for comparative purposes)
Weekly T2108

*All charts created using TeleChart:

Related links:
The T2108 Resource Page
Expanded daily chart of T2108 versus the S&P 500
Expanded weekly chart of T2108
Be careful out there!
Full disclosure: long shares and calls on SSO, long VXX puts, long GLD and GG
