(T2108 measures the percentage of stocks trading above their respective 40-day moving averages [DMAs]. To learn more about it, see my T2108 Resource Page.)
T2108 Status: 60% and neutral.
VIX Status: 17.
General (Short-term) Trading Call: Hold. Sell a few more longs and start identifying potential shorts.
Commentary
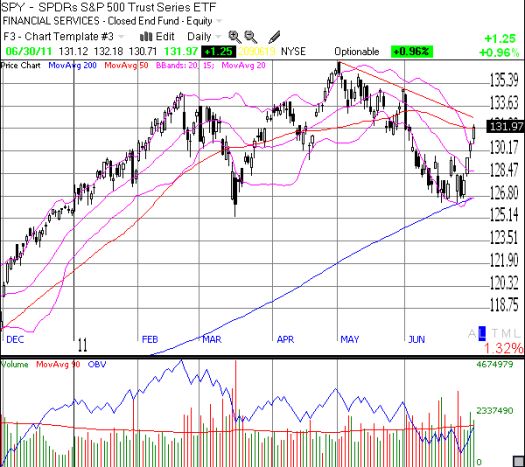
The current 4-day rally exhibits the kind of strength I hoped to see on the first bounce from oversold conditions. However, I am floored to see T2108 run so high so fast. At 60%, T2108 is at a level where short-term traders need to begin planning for overbought conditions. The mental shift will be challenging given it was just last week when it seemed the market was finally ready to break through critical support!
For the past two days, I have stated the bias remains bullish partially because T2108 has moved upward so strongly while the S&P 500 has taken much smaller steps upward. Today, the S&P 500 gained 1% but T2108 performed exceptionally well with a gain of 13 percentage points (27%!). So, once again, the bias remains bullish, and it is further bolstered by a strong close for the S&P 500 above its 50DMA.
Tomorrow is the beginning of the month which tends to have an upward bias. However, it is also the day before a holiday weekend. The index (SPY) is also below the immediate downtrend line (resistance) and sits above the upper Bollinger Band (index is stretched). I will call it a stalemate. I will be thoroughly impressed if the S&P 500 manages to eek out positive gains tomorrow and will be satisfied just with any close above the 50DMA.

Charts below are the latest snapshots of T2108 (and the S&P 500)
Refresh browser if the charts are the same as the last T2108 update.
Daily T2108 vs the S&P 500

Black line: T2108 (measured on the right); Red line: S&P 500 (for comparative purposes)
Weekly T2108

*All charts created using TeleChart:

Related links:
The T2108 Resource Page
Expanded daily chart of T2108 versus the S&P 500
Expanded weekly chart of T2108
Be careful out there!
Full disclosure: long SSO puts
