(T2108 measures the percentage of stocks trading above their respective 40-day moving averages [DMAs]. To learn more about it, see my T2108 Resource Page.)
T2108 Status: 33% and neutral.
VIX Status: 20; completely erased all gains from the oversold period.
General (Short-term) Trading Call: Hold (or lock in some profits to allow you the comfort to continue holding remaining trading longs until they test some natural line of resistance).
Commentary
Now TODAY was the kind of oversold bounce I was looking for!
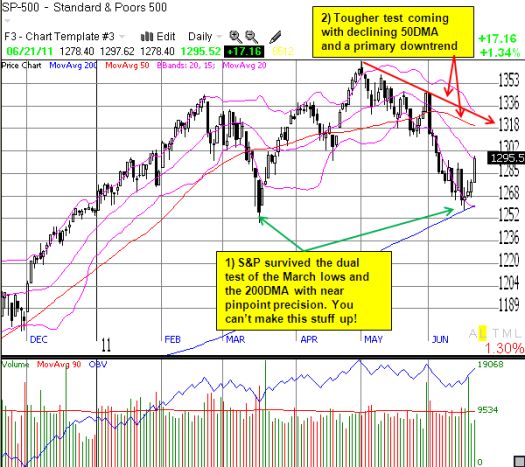
T2108 jumped to 33% as the S&P launched higher by 1.3%. Not only is the index now at two-week highs in a blink, but also the volatility index has lost all its gains from the two-day oversold period. A trader can now can get a wee bit more comfortable that a lasting bottom is in place (meaning the bias switches to buying on dips rather than shorting on rallies and NOT that the recent lows will never be broken again).
This whole trip into and out from the oversold period was also a great reminder of why executing to rules rather than to emotion is so important. The market felt awful during those two oversold days, yet, here we are now with a 4-day rally well in place that has essentially wiped out most traces of that oversold period. (Recall that 56% of all oversold periods lasting only 1-2 days.)
Key to my slight increase in optimism is that Apple (AAPL) finally woke up. AAPL gained an impressive 3% on the day and helped the NASDAQ gain 2.2%. AAPL still must prove itself as it closed just under the all-important 200-day moving average. Moreover, the overall downtrend in the S&P 500 is still intact and a declining 50DMA looms about 2% overhead. So, the bias is back in favor of the bulls, but there is little room for celebrating yet.

Charts below are the latest snapshots of T2108 (and the S&P 500)
Refresh browser if the charts are the same as the last T2108 update.
Daily T2108 vs the S&P 500

Black line: T2108 (measured on the right); Red line: S&P 500 (for comparative purposes)
Weekly T2108

*All charts created using TeleChart:

Related links:
The T2108 Resource Page
Expanded daily chart of T2108 versus the S&P 500
Expanded weekly chart of T2108
Be careful out there!
Full disclosure: long SSO puts, long AAPL calls
