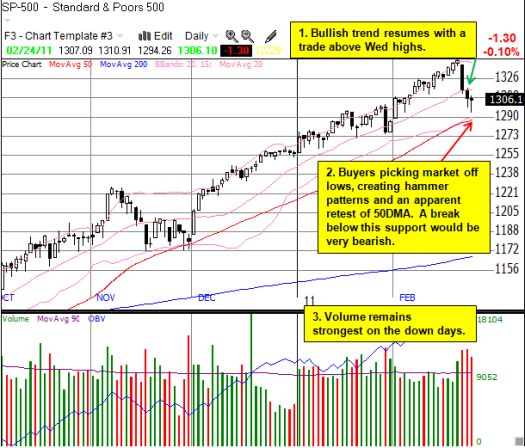
Buyers are again lifting the stock market from its intra-day lows and providing some potential clues on where to draw the bull/bear lines from a technical perspective.

The case for a bullish setup is relatively strong:
- Three days of high volume selling is washing out sellers.
- 50-day moving average (DMA) essentially successfully retested, leaving primary uptrend intact.
- First of month buying on March 1st (Tuesday) could confirm the setup: note the gains on the first day of the last three months – Dec, 2.2%; Jan, 1.1%; Feb, 1.7%.
In particular, the tendency for buyers to rush into the market on the first of the month provides additional intrigue for the classic bullish setup pattern shown above.
However, if the market fails to follow-through on the set-up, the subsequent selling could create a bull trap. For example, a gap down below the 50DMA would create a new line of resistance where once eager buyers turn into relieved sellers.
Moreover, market participants are likely starting to think through what a world without quantitative easing looks like. We are now just several months away from the scheduled end of QE2. There could be enough fear that the economy, and especially the stock market, cannot fare well for long without this kind of monetary accommodation. Some traders may even fear the Federal Reserve will bring QE2 to an early end (this would be very consistent with what I called Bernanke’s “cautious QE2” back in October). James Bullard, President and CEO of the St. Louis Federal Reserve Board, and currently a non-voting member of the Fed, made waves when discussing the possibility of an early end to QE2 after his main presentation “Quantitative Easing, Global Inflation, and Commodity Standards.” For example, he is quoted as saying:
“The natural debate now is whether to complete the program or to taper off to a somewhat lower level of assets…If it was just me, I would make small changes to account for the fact that the outlook is better than it was at the time of the November decision.”
Regardless of how much influence Bullard wields with his Fed colleagues, all eyes will certainly be trained on the next Federal Reserve meeting (March 15th).
Finally, T2108, the percentage of stocks trading above their 40DMAs, is at a very neutral 56%. Just three trading days ago, T2108 was flashing overbought and trading at 3-month highs. This rapid drop means many stocks have likely punched through important support lines in violent and abrupt ways and unsettled observers. However, any hopeful catalyst will likely send buyers rushing back in to fill this void. T2108 essentially says here the market is quite “comfortable” moving in either direction.
In other words, for this short-term, it is best not to aggressively anticipate any particular move, and it is much better to carefully observe behavior at the key levels shown in the above chart.
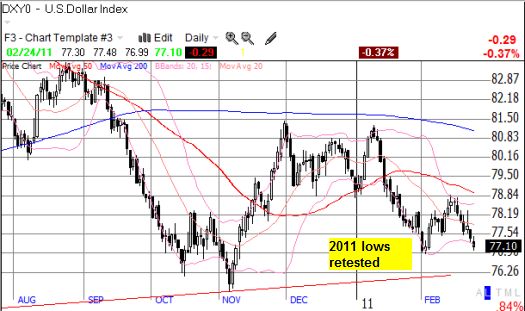
Speaking of key levels, the U.S. dollar index is retesting its lows for the year with the long-term support line (shown in red below) looking ready for a retest as well now. While I am positioned for one more/last bounce, one must really wonder whether a break of the long-term support line would be greeted with cheers, jeers, or fears in the stock market…

*All charts created using TeleChart:

Be careful out there!
Full disclosure: slightly net long the U.S. dollar
