
AT40 = 70.01% of stocks are trading above their respective 40-day moving averages (DMAs) – Day #1 of an overbought period
AT200 = 63.8% of stocks are trading above their respective 200DMAs
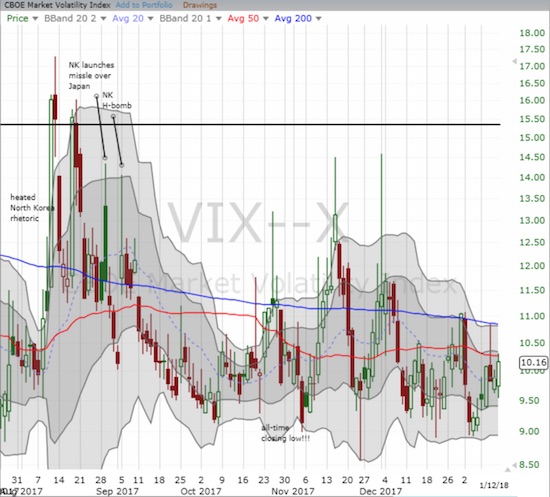
VIX = 10.2
Short-term Trading Call: bullish (upgraded from cautiously bullish)
Commentary
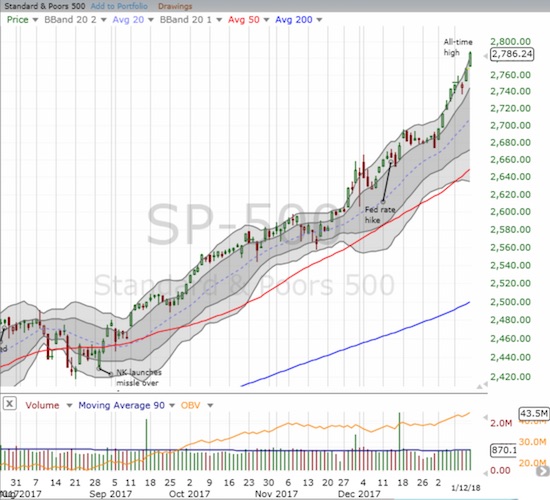
The stock market was last overbought three months ago. At the time, AT40 (T2108), the percentage of stocks trading above their respective 40-day moving averages (DMAs), ended a 12-day trip through overbought territory. During that period the S&P 500 (SPY) gained an additional 1.9% and set new all-time highs along the way. Even after the overbought period ended, the S&P 500 continued to creep higher with only minor hiccups as a bearish divergence widened for an entire month. In fact, the index has yet to look back since then.
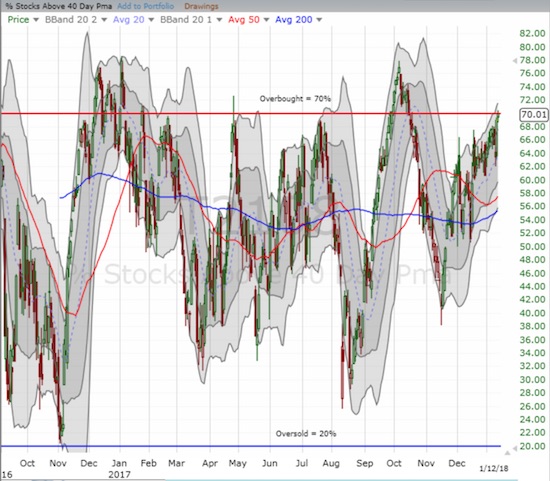
AT40 crossed the overbought threshold on Friday by the slimmest of margins by closing at 70.01%. When I first developed my method for trading AT40, I equated an overbought condition with a bearish signal. In recent years, the raging bull market taught me that a trending market going overbought confirms the buying power being applied to the market (see my resource page for more details). So, it takes at least one more confirming signal before I flip to bearish. These rules prevented me from making what would have been disastrous trading calls last Fall. For example, when T2108 fell from overbought conditions, I left my short-term trading call at bullish.
One bearish signal is the combination of AT40 dropping out of overbought territory AND the S&P 500 closing below a key line of technical support. So I am watching for the S&P 500 to hold the intraday low from last week’s one-day pullback. A close below that point and AT40 dropping from overbought will flip my trading call to bearish.
I am also watching for a potential blow-off top. As the chart above shows, the S&P 500 is ripping higher at an incredible pace. The persistent ability to press the upper-Bollinger Band (BB) is impressive, but buyers will eventually exhaust themselves. When that fatigue appears, I will the index simply drift and consolidate or will a blow-off top occur? A blow-off top is characterized by a buying panic with high trading volume and a large price gain quickly followed by rapid selling on high volume that cracks the low of the day of the top. A gap down the following day is particularly damaging. Such a pattern might flip me all the way to bearish even before AT40 falls out of overbought territory.
Interestingly, the volatility index, the VIX, has held firm through this robust buying effort. Over the last 8 trading days, the VIX has gained on every single day where the S&P 500 recorded a gain. The faders made a strong appearance on the one pullback day. This VIX resilience is something to watch and could be setting up the next VIX spike in the next week or two. As a result, I am still rotating through call options on ProShares Ultra VIX Short-Term Futures (UVXY). Recall that in this raging bull market, a VIX spike does not have to generate a significant sell-off. In fact, these days a drop of just 1% in the indices seems to create enough hand-wringing to simulate the sentiment drop of a real sell-off.
STOCK CHART REVIEWS
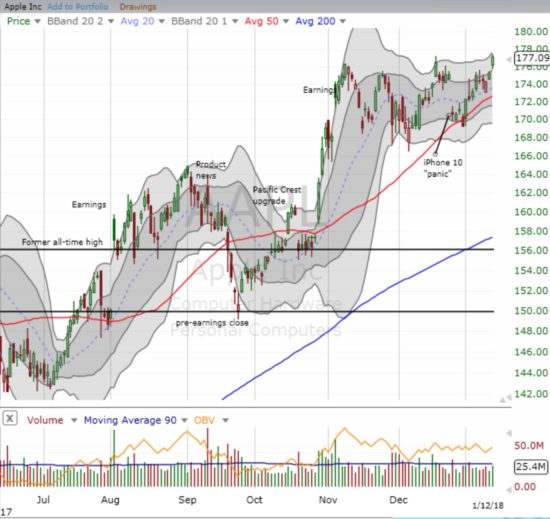
Apple (AAPL)
AAPL recorded a new all-time high on Friday. The stock broke through a triple top and has likely avoided the extremely rare quadruple top. This breakout essentially confirms the on-going bullish market sentiment in the market. I did not make a fresh weekly trade on call options given the trading holiday on Monday.
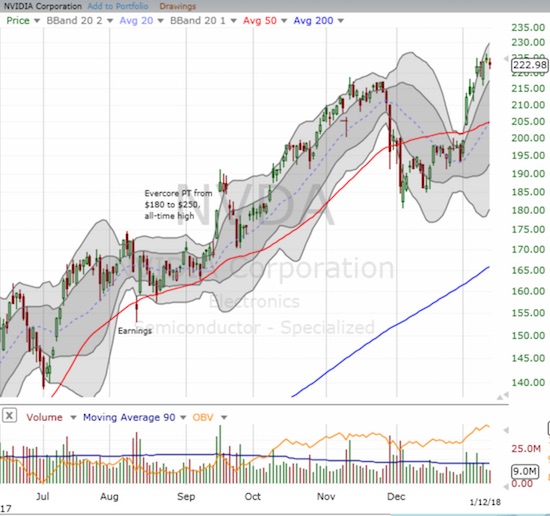
NVIDIA Corporation (NVDA)
NVDA is belatedly back on my buy-the-dip list. From a technical perspective, I should have bought the big 50DMA breakout on January 3rd. However, by the time I noticed the move, the stock was already well above its upper-BB and provided a poor risk/reward for a short-term trade. NVDA continued to defy gravity from there, but in recent days it has pulled back ever so slightly from its upper-BB. I am eyeing it like a hawk now. Like the great Caterpillar (CAT) trade, an ideal entry for NVDA will be a test of the lower bound of the upper-BB channel. (One could argue NVDA got “close enough” to such a test last week).
— – —
FOLLOW Dr. Duru’s commentary on financial markets via email, StockTwits, Twitter, and even Instagram!
“Above the 40” uses the percentage of stocks trading above their respective 40-day moving averages (DMAs) to assess the technical health of the stock market and to identify extremes in market sentiment that are likely to reverse. Abbreviated as AT40, Above the 40 is an alternative label for “T2108” which was created by Worden. Learn more about T2108 on my T2108 Resource Page. AT200, or T2107, measures the percentage of stocks trading above their respective 200DMAs.
Active AT40 (T2108) periods: Day #474 over 20%, Day #288 over 30%, Day #88 over 40%, Day #36 over 50%, Day #27 over 60%, Day #1 over 70% (overbought period ended 61 days below 70%)
Daily AT40 (T2108)
")
Black line: AT40 (T2108) (% measured on the right)
Red line: Overbought threshold (70%); Blue line: Oversold threshold (20%)
Weekly AT40 (T2108)

*All charts created using freestockcharts.com unless otherwise stated
The charts above are my LATEST updates independent of the date of this given AT40 post. For my latest AT40 post click here.
Related links:
The T2108 Resource Page
You can follow real-time T2108 commentary on twitter using the #T2108 or #AT40 hashtags. T2108-related trades and other trades are occasionally posted on twitter using the #120trade hashtag.
Be careful out there!
Full disclosure: long UVXY calls
*Charting notes: FreeStockCharts.com uses midnight U.S. Eastern time as the close for currencies. Stock prices are not adjusted for dividends.
The only danger on the horizon is a potential government shutdown at the end of this week.
Which I don’t think the market cares about until a shutdown actually happens AND bills don’t get paid.