
(T2108 measures the percentage of stocks trading above their respective 40-day moving averages [DMAs]. It helps to identify extremes in market sentiment that are likely to reverse. To learn more about it, see my T2108 Resource Page. You can follow real-time T2108 commentary on twitter using the #T2108 hashtag. T2108-related trades and other trades are occasionally posted on twitter using the #120trade hashtag. T2107 measures the percentage of stocks trading above their respective 200DMAs)
T2108 Status: 36.1%
T2107 Status: 37.5%
VIX Status: 12.5 (was as low as 10.9!!!)
General (Short-term) Trading Call: Neutral
Active T2108 periods: Day #198 over 20%, Day #6 over 30% (overperiod), Day #13 under 40%, Day #53 under 50%, Day #70 under 60%, Day #269 under 70%
Reference Charts (click for view of last 6 months from Stockcharts.com):
S&P 500 or SPY
SDS (ProShares UltraShort S&P500)
U.S. Dollar Index (volatility index)
EEM (iShares MSCI Emerging Markets)
VIX (volatility index)
VXX (iPath S&P 500 VIX Short-Term Futures ETN)
EWG (iShares MSCI Germany Index Fund)
CAT (Caterpillar).
Commentary
As I feared, the surprise bullish divergence that ended July amounted to little. August started trading with follow-through selling, not reversal buying. The selling continued into a minor breakdown below the 50-day moving average (DMA) on Tuesday. The S&P 500 (SPY) finally broke the losing streak on Wednesday (August 5, 2015), but the index experienced a strong fade back to the 50DMA.
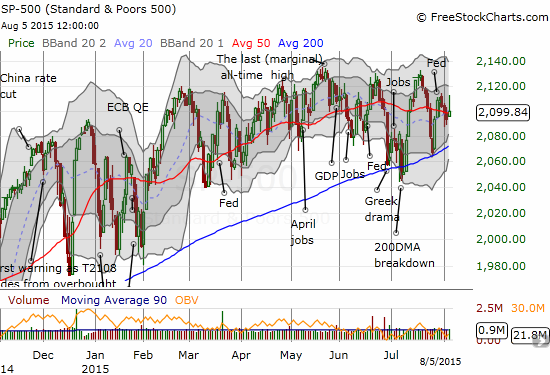
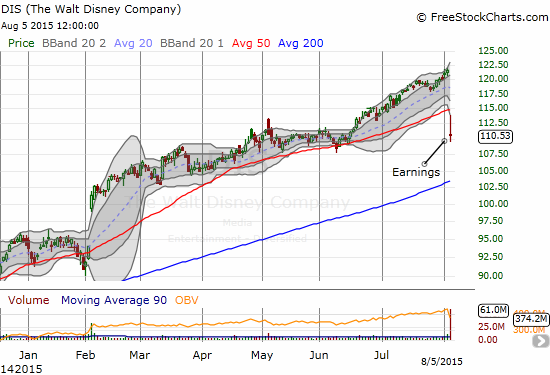
The relative calm of the S&P 500 continues to surprise me given the number of high-profile stocks that have experienced post-earnings plunges. The market is particularly unfazed by the on-going collapse in commodities. Moreover, the volatility index, the VIX, is scratching at multi-year lows and plunged below 11 before rallying on the day.
Most fascinating is that both T2108 and T2107 (the percentage of stocks trading above their respective 200DMAs) continue to languish below 40% even as the S&P 500 trades within “spitting distance” of its all-time high. The readings on T2108 and T2107 mean that the majority of stocks in the stock market are WEAK relative to important moving averages. As more and more leaders tumble, the market is more and more propped up by fewer and fewer stocks. This is a VERY precarious situation.
One bear who is taking notice and chomping at the bit is money manager Bill Fleckenstein. I thank Fleckenstein for getting me into gold starting in 2004 and mroeso in 2006. He was always a voice of reason in a market that made little sense to me at the time; my main regret is that I failed to tune out all the noise around sage advice like his. Fleckenstein took his profits and closed his short-only fund in 2009 right around the historic bottom of the market. Ever since, he has stuck to his bearish opinion on the Federal Reserve and the economy. I was admittedly a bit disappointed that he stayed so staunchly bearish even as the market soared year-after-year (I assume he also remains as bullish as ever on gold). However, “Fleck” avoided putting his money where his mouth was all this time…until now.
Fleck is rushing to get his short fund started again. He anticipates an October 1st launch. He says he would launch it today if not for the logistics of getting the fund going again. (You can find the video below on CNBC along with a summary).
Fleck sees a lot of opportunities for shorting…starting with semiconductors. He sees inventory saturation that will lead to a correction across PCs, cellphones, and industrials.
On the macro side, Fleck thinks the Fed is “trapped” because it cannot ease from here to respond to any coming economic weakness. He also thinks the market is very brittle and crash prone. He admits, as usual, that he could be wrong, so he is scaling slowly into his trades. He is already short some names and owns put options.
I consider Fleck’s return as flashing a bright red warning signal. I conflicted because I do not think I am mentally ready for a full out sell-off or even thinking through the prospects for one (for example, I remain a bull on the housing market). In the meantime, I am staying neutral on my short-term trading call, and I am sticking with my T2108 framework. My deep respect for Fleck requires that I stay on high alert for any bearish signals and aggressively act on them when (if?) they appear.
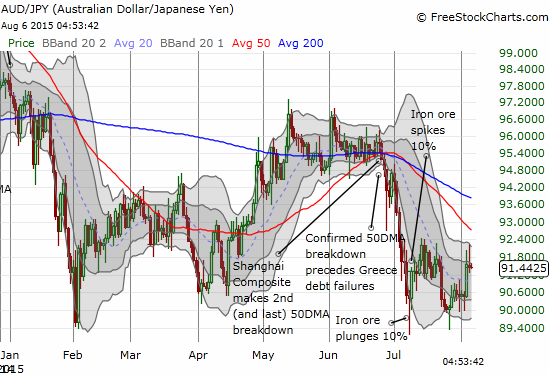
Since T2108 (and T2107) are already so low, I can easily see getting short below overbought levels. So, other signals will take on greater importance than usual. In particular, I will be reading the tea leaves in currency markets ever more closely. My favorite confirmation of bear/bull biases is the Australian dollar (FXA) versus the Japanese yen (FXY). So far, like the general market, AUD/JPY is signaling relative calm as it is still well off recent lows. A break below these lows would be very bearish. For my most recent post on the Australian dollar, see “A Mysterious Omission By The Reserve Bank Of Australia Lifts The Australian Dollar.”
Daily T2108 vs the S&P 500
")
Black line: T2108 (measured on the right); Green line: S&P 500 (for comparative purposes)
Red line: T2108 Overbought (70%); Blue line: T2108 Oversold (20%)
Weekly T2108

*All charts created using freestockcharts.com unless otherwise stated
The charts above are the my LATEST updates independent of the date of this given T2108 post. For my latest T2108 post click here.
Related links:
The T2108 Resource Page
Expanded daily chart of T2108 versus the S&P 500
Expanded weekly chart of T2108
Be careful out there!
Full disclosure: long GLD