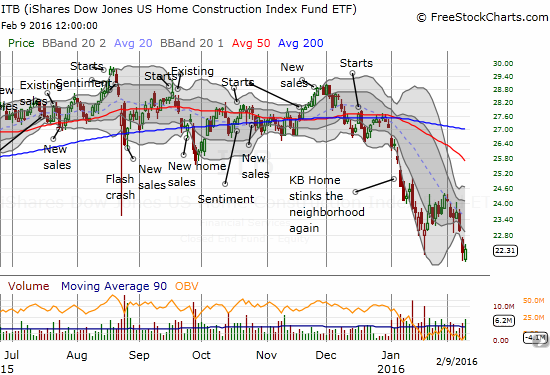
The last Housing Market Review covered data released in December, 2015. At the time, I saw the market coiling like a spring. Instead of springing forth, housing market stocks are in big retreat. Recession fears likely have a lot to do with the declines. The iShares US Home Construction ETF (ITB) is now down a gut-wrenching 18% year-to-date. ITB trades at levels last seen October, 2014. The S&P 500 (SPY) is trading at the same relative level, but it has “only” declined 9% year-to-date.
Source: FreeStockCharts.com
Ironically, the housing data for 2015 that preceded ITB’s plunge set post-recession records across the board…
New Residential Construction (Housing Starts) – December, 2015
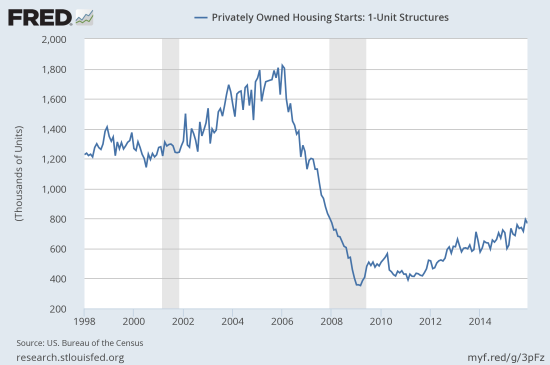
Privately owned housing starts for 1-unit structures came in at 768,000. The November 1-unit starts were revised upward to 794,000 and became the new post-recession record. This beat out the previous record of 758,000 hit in July, 2015.
Source: US. Bureau of the Census, Privately Owned Housing Starts: 1-Unit Structures [HOUST1F], retrieved from FRED, Federal Reserve Bank of St. Louis, February 9, 2016.
The 6.1% year-over-year gain and 3.3% month-over-month drop are consistent with the mixed picture from the confidence of home builders (see below). The Northeast led the regions with a 25.0% year-over-year gain. The West and the South followed with 10.4% and 10.0% gains respectively. The Midwest lagged again, this time with a very large 18.9% drop. The poor performance from the Midwest stands in stark contrast to the slowdown/drop I keep expecting to see in the South region because of Texas.
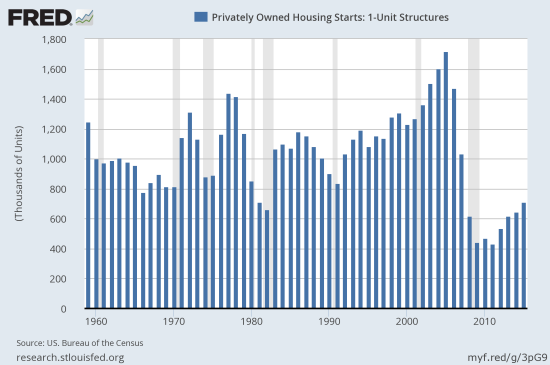
The solid end to the year selaed the deal on the strongest full year since the financial crisis and recession. Of course, starts are still at recessionary levels, but the trend and momentum continue to be encouraging.
Source: US. Bureau of the Census, Privately Owned Housing Starts: 1-Unit Structures [HOUST1F], retrieved from FRED, Federal Reserve Bank of St. Louis, February 9, 2016.
New Residential Sales – December, 2015
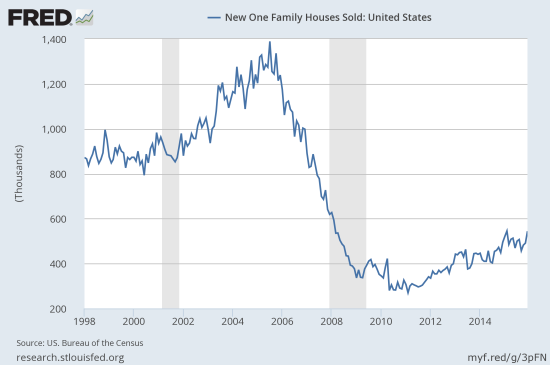
New single-family home sales hit 544,000, a robust 9.9% year-over-year gain and an impressive increase of 10.8% over November’s sales. The turn-around in the downtrend from the 2015 peak came as I projected in the last Housing Market Review.
Source: US. Bureau of the Census, New One Family Houses Sold: United States [HSN1F], retrieved from FRED, Federal Reserve Bank of St. Louis, February 9, 2016.
The strong uptick in sales punched new home sales inventory from 5.7 months at the current sales rate to 5.2 months. Six months is typically considered balanced. The Midwest sticks out with a 38.9% year-over-year gain in sales which stands in stark contrast with the on-going lackluster starts data in the region. The West came in second with a 21.9% year-over-year gain. The South was exactly flat, and the Northeast fell by 6.5%. Texas is a large part of the story of the South, so it is very possible the flat performance is indicative of a Texas housing market that is finally slowing down. I will be watching this as closely as ever.
The solid end to 2015 put annual sales at 501,000. This 14.5% year-over-year gain set a new post-recession record for annual sales. The recovery picked up pace again as sales finally went over levels last seen in 2008.
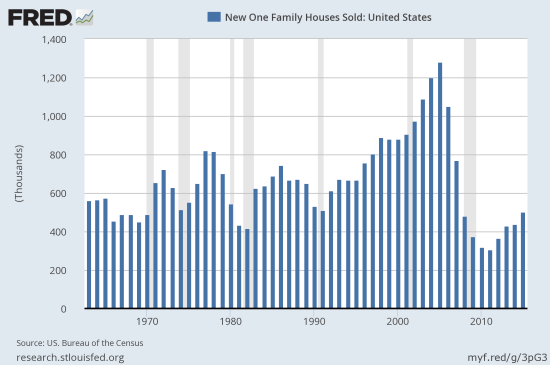
Source: US. Bureau of the Census, New One Family Houses Sold: United States [HSN1F], retrieved from FRED, Federal Reserve Bank of St. Louis, February 9, 2016.
Existing Home Sales – December, 2015
The National Association of Realtors (NAR) apparently correctly blamed November’s plunge in existing sales on a regulatory air pocket (“Know Before You Owe”). Sales came roaring back in December with a 7.7% year-over-year gain. The NAR described the 14.7% month-over-month increase as the largest on record, but this was of course a result of the extraordinary drop that occurred in November. Like starts and new home sales, existing home sales ended 2015 on a strong note. Annual sales have not been this high since 2006.
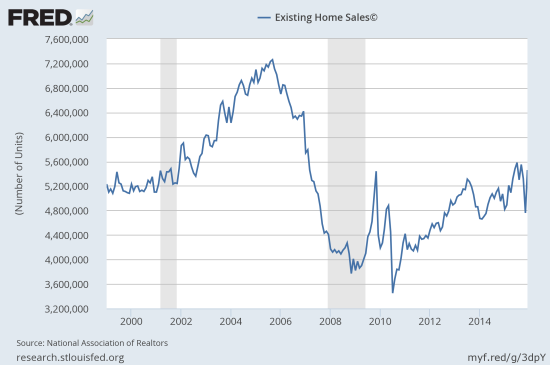

Source: National Association of Realtors, Existing Home Sales© [EXHOSLUSM495S], retrieved from FRED, Federal Reserve Bank of St. Louis, February 9, 2016.
The surge in sales came at a cost. The inventory of existing homes for sale dropped sharply to a 3.9-month supply. This is the lowest rate since January, 2005 when it stood at 3.6%! Hopefully the market will soon come into better balance as the residual impact of the regulatory hiccup works its way through the system. Inventory was 5.1 months of sales in November. The drop in supply is one factor that has moderated the expectations for 2016 of NAR’s chief economist Lawrence Yun:
“Although some growth is expected, the housing market will struggle in 2016 to replicate last year’s 7 percent increase in sales…In addition to insufficient supply levels, the overall pace of sales this year will be constricted by tepid economic expansion, rising mortgage rates and decreasing demand for buying in oil-producing metro areas.”
The story for first-time home buyers is also very lukewarm. The annual share of 30% for first-timers is only up one percentage point from 2013 and 2014. This is the final confirmation of my expectations that new home buyers would make no progress in 2015.
Home Builder Confidence: The Housing Market Index– January, 2016
The Housing Market Index (HMI) stayed flat with a downwardly revised December index at 60. This flat performance of the overall index hides a stark divergence between current and future sales conditions. Current sales conditions rose 2 points to 67 while sales expectations 6 months out dropped a surprising 3 points to 63. The component for buyer traffic also fell. The chart below shows the rarity of this kind of divergence. I will be watching carefully to see whether the drops continue. They could provide a leading indicator even as current conditions look good.
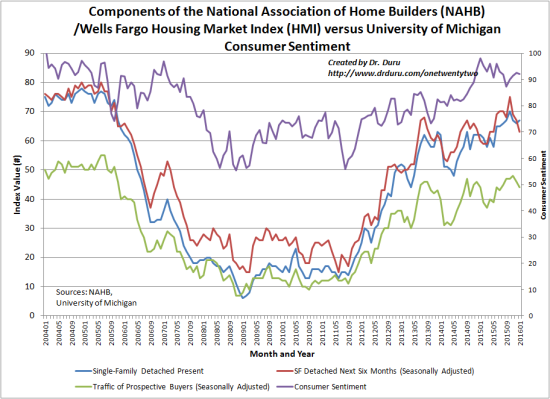
Source: The National Association of Home Builders (NAHB)
The three-month moving averages for regional HMI scores declined in all four regions of the country. There must be some rounding error given the overall index was flat with the previous month. Regardless, the broad decline has my attention as well as the breakdown of the individual components.
Parting thoughts
The strong housing numbers of 2015 augur well for the Spring selling season. The extremely weak performance of ITB this year contrasts greatly with the strong 2015 performance. Unfortunately, the earnings of home builders have not boosted confidence in the market. For example, KB Home (KBH) disappointed big-time. Meritage Homes (MTH) delivered earnings on January 28, 2016 that sent the stock soaring 14% off prices last seen in mid-2012. However, those gains have almost all reversed as the stock failed to gain any follow-through momentum. The home builder confidence for January also presents cause for pause given the drop in expectations for future sales. Finally, the NAR’s chief economist clearly has put a lid on expectations for 2016’s housing market.
So I think of the housing market at an important crossroads with strong results from the rear but an ever more shadowy outlook ahead. The market is racing to try to price in some kind of economic slowdown or even recession and generating some extremely cheap home builder stocks. I am treating this as a buying opportunity even as I remain wary about the overall stock market. Assuming no recession is forthcoming, the stocks of home builders should deliver tremendous upside over the balance of this year. The upside may push out into early 2017 given the seasonal strength in home builder stocks typically ends with the Spring selling season.
Be careful out there!
Full disclosure: long ITB call options, long KBH call options
