
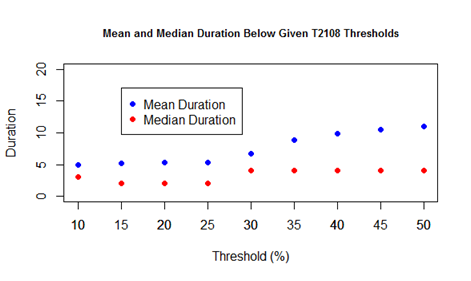
(T2108 measures the percentage of stocks trading above their respective 40-day moving averages [DMAs]. It helps to identify extremes in market sentiment that are likely to reverse. To learn more about it, see my T2108 Resource Page. You can follow real-time T2108 commentary on twitter using the #T2108 hashtag. T2108-related trades and other trades are occasionally posted on twitter using the #120trade hashtag. T2107 measures the percentage of stocks trading above their respective 200DMAs)
T2108 Status: 21.5% (ends 2 days at oversold)
T2107 Status: 24.7%
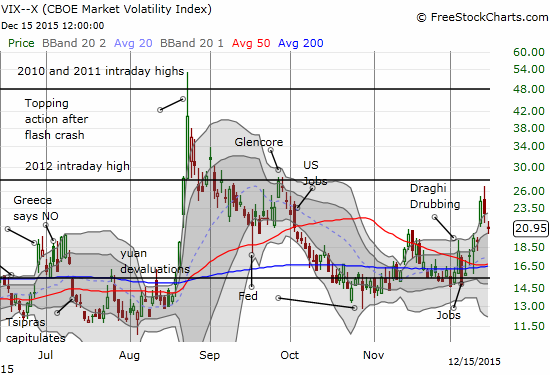
VIX Status: 21.0
General (Short-term) Trading Call: bullish
Active T2108 periods: Day #1 over 20% (overperiod ended 2-day oversold period), Day #4 under 30%, Day #5 under 40%, Day #9 below 50%, Day #24 under 60%, Day #365 under 70%
Reference Charts (click for view of last 6 months from Stockcharts.com):
S&P 500 or SPY
SDS (ProShares UltraShort S&P500)
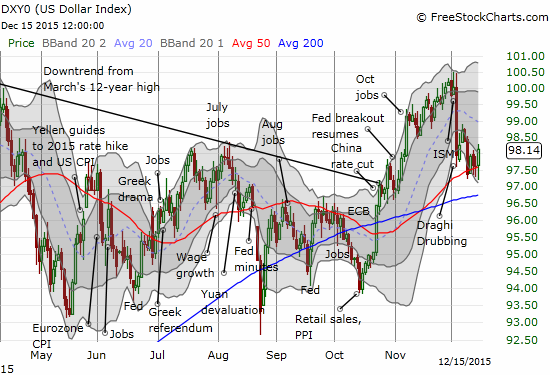
U.S. Dollar Index (volatility index)
EEM (iShares MSCI Emerging Markets)
VIX (volatility index)
VXX (iPath S&P 500 VIX Short-Term Futures ETN)
EWG (iShares MSCI Germany Index Fund)
CAT (Caterpillar).
IBB (iShares Nasdaq Biotechnology).
Commentary
The market must have heard my complaining in the last T2108 Update about an unconvincing bounce. For today (December 15, 2015), the S&P 500 (SPY) delivered a strong upward push from BOTH the index and T2108 along with a plunge in the volatility index, the VIX. T2108 surged from 16.0 to 21.5%.
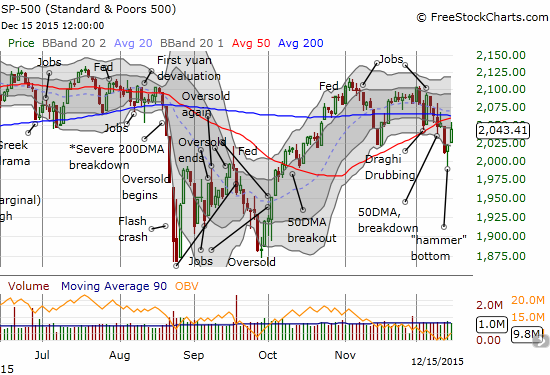
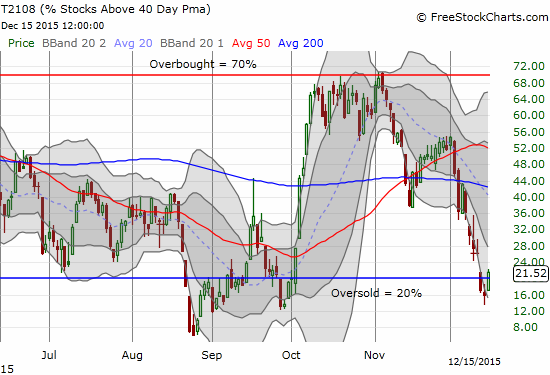
Despite this strong showing, I remain wary. This bounce left some stragglers behind which keeps with the theme of of a market with exclusive participation. The S&P 500 managed to reverse all its losses from the oversold period, but T2108 fell well short. This means that there is a small group of stocks that lost so much during the oversold period, they were not able to ride enough of the market’s coattails to experience a recovery. The market exited oversold conditions with fewer stocks trading above their respective 40DMAs than when it entered.
The volatility index is also holding onto some of its gains from the oversold period. On top of all this, the S&P 500 pulled back from resistance at its 50-day moving average (DMA); in previous posts I expressed doubts that buyers could push through this resistance anytime soon.
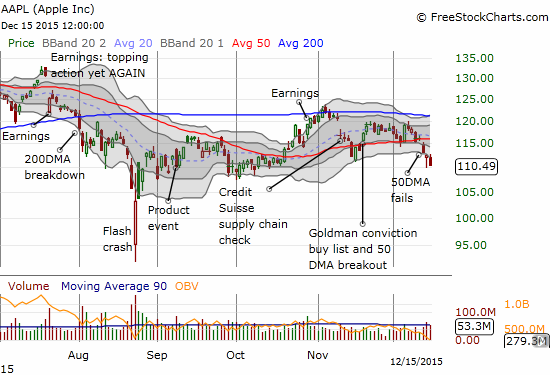
Apple (AAPL) is one of the more troubling laggards. I made a very wrong call expecting AAPL to fully participate in an oversold rally. AAPL experienced VERY poor relative performance with a decline of 1.8% on strong trading volume. This selling confirms a now very bearish breakdown from 50DMA support.
As a result of my skepticism, I used the rally to unload most of my trades from the oversold period and locked in profits. As a reminder, the typical oversold period lasts just one or two days. This brevity motivates me to trade oversold periods aggressively right from the start. As I mentioned earlier, I did not trade this oversold period as aggressively as is typical for me.
It helped that I did not want to expose these profits to the risk that the market reacts negatively to whatever the Fed has in store for us. In particular, I sold my call options on ProShares Ultra S&P500 (SSO). I kept my shares in ProShares Short VIX Short-Term Futures (SVXY) as a play on a post-Fed volatility implosion. I even sold my put options on iShares 20+ Year Treasury Bond (TLT) right after the open.
@rbowley – volatility spike may have already happened! I am in $SVXY. I play $UVXY puts if #VIX spikes again post-Fed.
— Duru A (@DrDuru) Dec. 15 at 03:11 PM
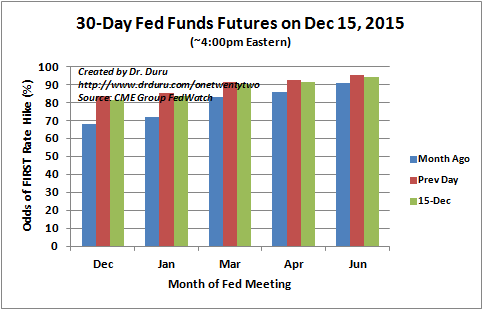
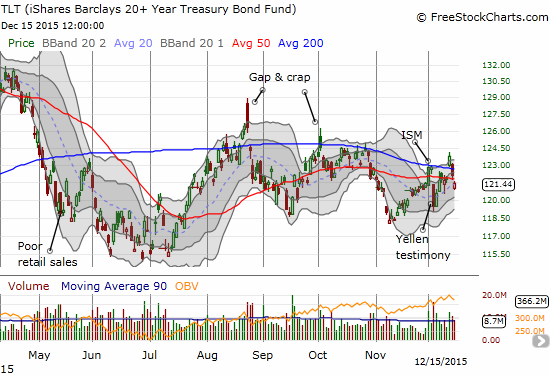
The Fed’s statement on monetary policy could completely alter the market’s technical position. Being able to react will be much more important than trying to predict both the Fed’s move and the market’s response(s). Here is a final look at the odds of a December rate hike, the dollar index’s resulting positioning, and TLT showing that the market is still reluctant to sell off bonds just yet. It is as if the market is afraid that the Fed’s rate hike will initiate the kind of economic calamity that will force scared and panicked investors scrambling for the “safety” of U.S. government bonds.
Daily T2108 vs the S&P 500
")
Black line: T2108 (measured on the right); Green line: S&P 500 (for comparative purposes)
Red line: T2108 Overbought (70%); Blue line: T2108 Oversold (20%)
Weekly T2108

*All charts created using freestockcharts.com unless otherwise stated
The charts above are the my LATEST updates independent of the date of this given T2108 post. For my latest T2108 post click here.
Related links:
The T2108 Resource Page
Expanded daily chart of T2108 versus the S&P 500
Expanded weekly chart of T2108
Be careful out there!
Full disclosure: long SVXY shares, long TLT call spread, long AAPL call options