
(T2108 measures the percentage of stocks trading above their respective 40-day moving averages [DMAs]. It helps to identify extremes in market sentiment that are likely to reverse. To learn more about it, see my T2108 Resource Page. You can follow real-time T2108 commentary on twitter using the #T2108 hashtag. T2108-related trades and other trades are occasionally posted on twitter using the #120trade hashtag. T2107 measures the percentage of stocks trading above their respective 200DMAs)
T2108 Status: 57.9%
T2107 Status: 26.8%
VIX Status: 18.4
General (Short-term) Trading Call: Neutral (target of 1996 on the S&P 500 has already occurred ahead of overbought conditions. See “From the Edge of A Breakout to the Ledge of A Breakdown” for more details).
Active T2108 periods: Day #4 over 20%, Day #3 over 30%, Day #3 over 40%, Day #1 over 50% (ending 95 days under 50%), Day #113 under 60%, Day #318 under 70%
Reference Charts (click for view of last 6 months from Stockcharts.com):
S&P 500 or SPY
SDS (ProShares UltraShort S&P500)
U.S. Dollar Index (volatility index)
EEM (iShares MSCI Emerging Markets)
VIX (volatility index)
VXX (iPath S&P 500 VIX Short-Term Futures ETN)
EWG (iShares MSCI Germany Index Fund)
CAT (Caterpillar).
IBB (iShares Nasdaq Biotechnology).
Commentary
It has been a whopping 95 trading days since T2108 last traded above 50%. Could a trip to overbought conditions, something unseen in now 318 days, be right around the corner?
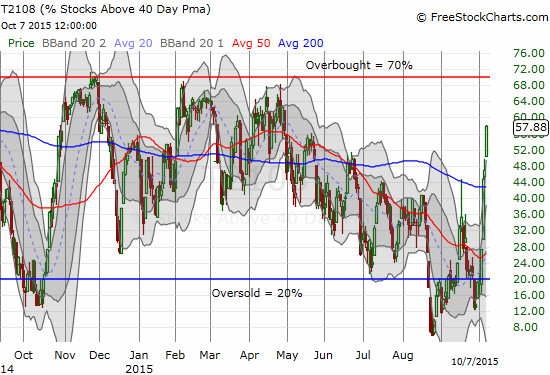
T2108 was last at current levels back in April. Those were the days when the S&P 500 (SPY) was still making new marginal all-time highs. Now, the index is bumping up against its downtrending 50-day moving average (DMA) for the first time since the big breakdown in August.
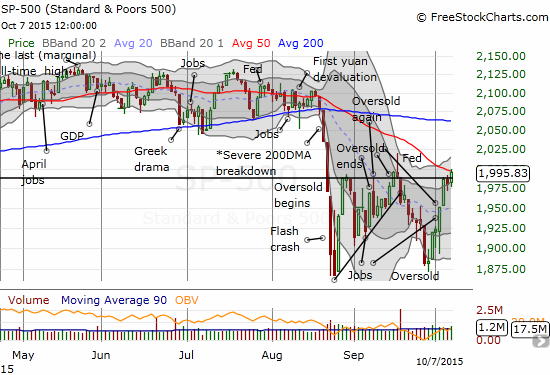
The S&P 500 has printed an interesting W-bottom that faces a LOT of resistance at current levels. My upside target before hitting overbought conditions was 1996. The index is ahead of schedule, but I am back to a much more wary stance anyway. I have changed the trading call from bullish to neutral. To be clear, I have NOT gone from bullish to bearish. I am just more willing to entertain bearish positions, and I am more inclined to lock in profits on bullish positions. Caterpillar (CAT) triggered my first large wave of selling.
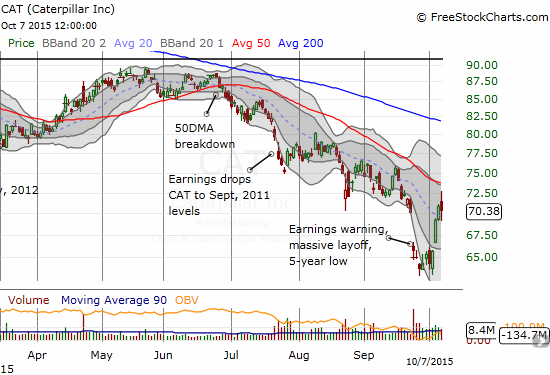
My favorite hedge against bullishness suffered what I think is a significant reversal a day after it, amazingly enough, closed its post-earnings gap down. The stalemate between buyers and sellers produced a negative close and relative weakness compared to the S&P 500. I used this moment to add to my CAT hedge.
Outside of CAT, bulls and buyers could point to numerous positive signs. For example, the volatility index, the VIX, continued to fall. It is now below 20; above 20, many technicians characterize the market as being in a state of elevated fear. The VIX now seems all but sure to retest the all-important 15.35 pivot in due time.
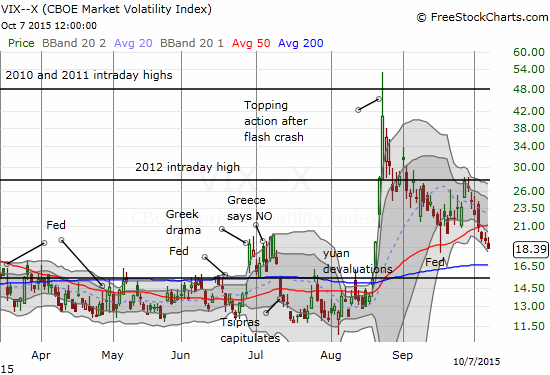
This chart speaks volumes about the profitability of the strategy for fading spikes in volatility.
Intel (INTC) is a stock I have not covered in a long while. For several quarters, I have maintained a strategy of buying and selling INTC between earnings. I sold my last tranche of call options on Tuesday as the stock ran into its 200DMA. I still have to blink when looking at this chart. INTC is now working on a 200DMA breakout that represents a 25% surge from its lowest close during the post-breakdown period. Note the near picture-perfect bounce off the 50DMA.
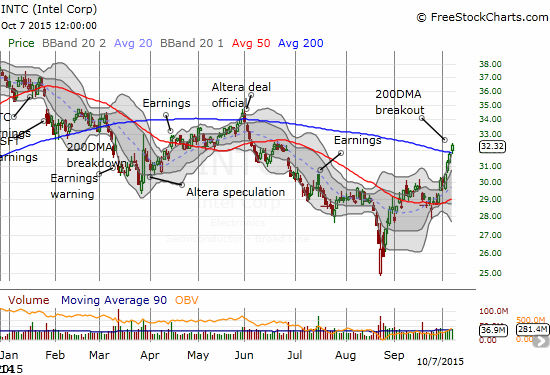
With earnings approaching again, I am fine being out of my position here. I now await my next opportunity for a post-earnings buy.
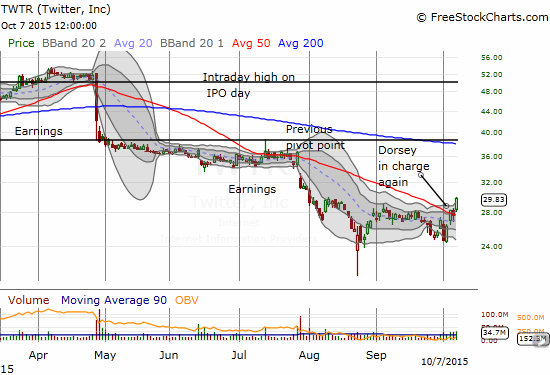
At the end of August, I wrote “How to Buy Twitter’s Stock for Less Than $20/Share.” That positioning is finally starting to pay off as TWTR breaks out above its 50DMA for its highest close since early August. The stock obviously has a LONG way to go to repair a LOT of damage. If it can finally survive an earnings call without suffering calamitous selling, the TWTR position should pay off even faster.
Some of the most dramatic moves of the day came from the commodity-related side of the market. CAT aside, a major upgrade from Morgan Stanley seemed to help several miners soar into breakouts. For example, Rio Tinto (RIO) gained 7.8% on the day and closed well above its 50DMA resistance. The numbers in the chart below represent the approximate price of iron ore on select trading days.
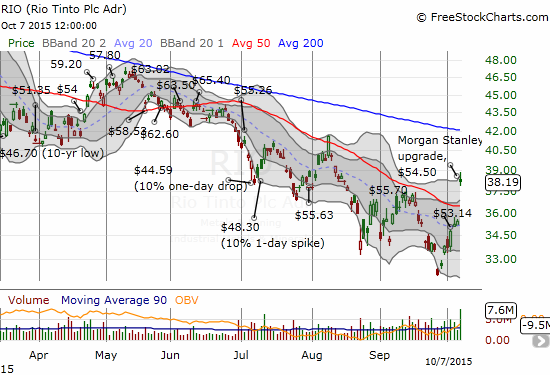
Morgan’s upgrade was bizarre given just last week analysts at the brokerage DOWNGRADED iron ore prices. I extend a hat tip to a commenter on Seeking Alpha for pointing out this bizarre contradiction. I hope to write more about this in coming days. For now, suffice to say that I am VERY skeptical of the Morgan-led charge in commodity plays. I am guessing Morgan created just enough confusion and fear to send well-entrenched shorts scrambling for cover. I used the opportunity to unload some speculative call options on RIO. I also added to put options on BHP Billiton Limited (BHP).
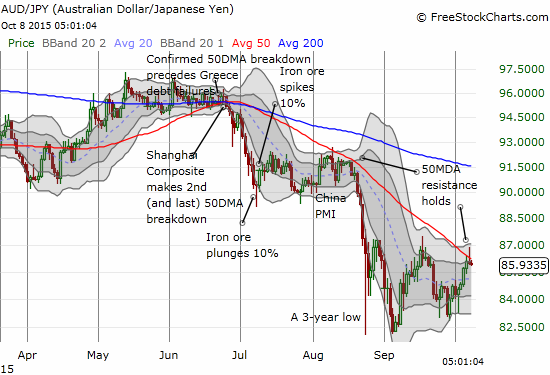
The Australian dollar (FXA) is looming over the continued bullishness in the market. The good run that the currency has enjoyed since the last oversold period ended seems to be losing momentum. I have used this period to slowly but VERY surely rebuild short positions against the currency. Along with CAT’s reversal, the failure of the Australian dollar to hold its 50DMA breakout against the Japanese yen (FXY) reinforced my desire to exit a large number of my bullish trading positions. I strongly suspect that a visit to overbought conditions on T2108 will find me outright bearish, but I will cross that bridge when the market gets there. As always, I am taking the market one T2108 step at a time.
Daily T2108 vs the S&P 500
")
Black line: T2108 (measured on the right); Green line: S&P 500 (for comparative purposes)
Red line: T2108 Overbought (70%); Blue line: T2108 Oversold (20%)
Weekly T2108

*All charts created using freestockcharts.com unless otherwise stated
The charts above are the my LATEST updates independent of the date of this given T2108 post. For my latest T2108 post click here.
Related links:
The T2108 Resource Page
Expanded daily chart of T2108 versus the S&P 500
Expanded weekly chart of T2108
Be careful out there!
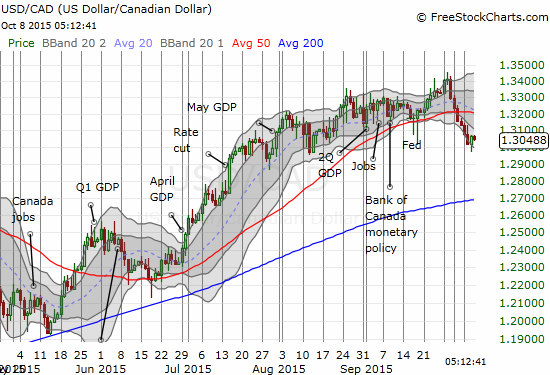
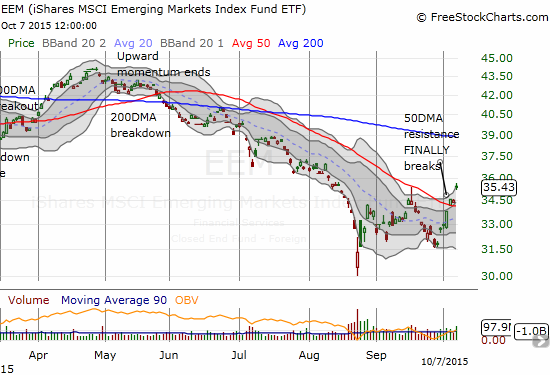
Full disclosure: long SVXY shares, long SSO shares, short CAT, short AUD/JPY, short TWTR put options, long RIO call options, long BHP put and call options, long USD/CAD, long EEM put options