
(T2108 measures the percentage of stocks trading above their respective 40-day moving averages [DMAs]. It helps to identify extremes in market sentiment that are likely to reverse. To learn more about it, see my T2108 Resource Page. You can follow real-time T2108 commentary on twitter using the #T2108 hashtag. T2108-related trades and other trades are sometimes posted on twitter using the #120trade hashtag. T2107 measures the percentage of stocks trading above their respective 200DMAs)
T2108 Status: 24.6% (ending a 1-day oversold period)
T2107 Status: 42.6%
VIX Status: 15.1
General (Short-term) Trading Call: Hold remaining shorts (should have already closed most); take profits on some longs, try to ride through test of 50DMA resistance (see below for more details)
Active T2108 periods: Day #1 under 20% (undersold period), Day #11 under 30%, Day #17 under 40%, Day #19 under 50%, Day #21 under 60%, Day #63 under 70%
Reference Charts (click for view of last 6 months from Stockcharts.com):
S&P 500 or SPY
SDS (ProShares UltraShort S&P500)
U.S. Dollar Index (volatility index)
EEM (iShares MSCI Emerging Markets)
VIX (volatility index)
VXX (iPath S&P 500 VIX Short-Term Futures ETN)
EWG (iShares MSCI Germany Index Fund)
CAT (Caterpillar).
Commentary
THIS time I used today’s pop to load up on some put options on Caterpillar (CAT) as my favorite downside hedge. Beyond that, it was a day to celebrate all things T2108. The market’s powerful surge higher served as a powerful reinforcement of the importance of following trading rules. This day also reminded me (and hopefully regular readers) why I love T2108 so much as a market indicator.
Speaking of rules, I will start this post off with another entry in the “you wouldn’t believe it unless you saw it” category. I just can’t make this stuff up. As you may recall from the last T2108 Update, my next trigger for accumulating more call options on ProShares Ultra S&P500 (SSO) featured the volatility index, the VIX, punching through earlier highs. Such a move typically marks either the peak of market fear or the beginning of its end. The VIX traded RIGHT up to that high and then sharply reversed. Leaving me without a trade that perhaps could have delivered one of my biggest of the year given my plans to ramp up my aggressiveness on the long side.
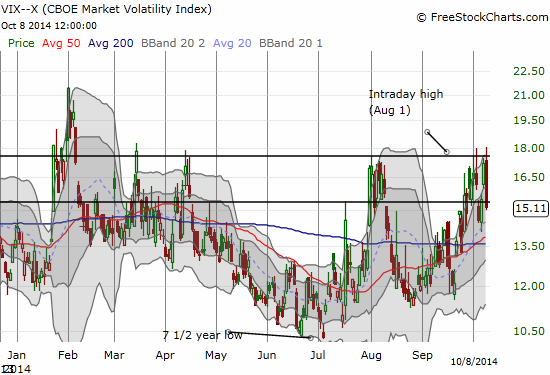
So while today was a huge bonanza for me on SSO call options, it incredibly could have been a whole lot greater by a mere smudge on a chart. I used the rally to lock in profits on about half of my position. I will try to ride the rest. Another lesson I have learned and relearned from T2108 trades is that I have a bad habit of underestimating just how fast and high an oversold rally can move. I have left the other half of my position to take advantage of any buying follow-through in the coming days and week. The oversold bounce is off to a strong start with the VIX getting pushed below the 15.35 pivot. However, note that the grinding uptrend from 7 1/2 year lows is not over.
T2108 ended the 1-day oversold period with a tremendous exclamation point. T2108 closed at 24.7%, jumping by 42% over yesterday’s close of 17.4%. I fully recognize the rally is suspect given it comes in response to the minutes of the last Federal Reserve meeting (more on this in another post), but this kind of buying must be respected. Note well how post-Fed trading yet again featured a massive reversal in volatility. I decided to continue holding my put options on ProShares Ultra VIX Short-Term Futures (UVXY) as part of my attempt to remain more patient through the oversold bounce.
The baton has clearly moved from sellers back to buyers already. The buyers now have a major test immediately in front of them in the form of the 50-day moving average (DMA) as resistance on both the S&P 500 (SPY) and the NASDAQ (QQQ).
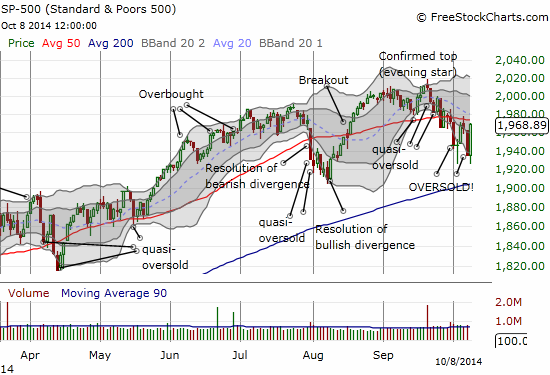
The 50DMA is starting to turn downward, and the 20DMA is already rushing fast downward. So resistance COULD be just as tough as it has been since the S&P 500 first sliced through the 50DMA on September 25th. Note in the chart above how easily the index has moved across this line. Bulls, and bears, should take nothing for granted here and need to just stay nimble (and follow rules!).
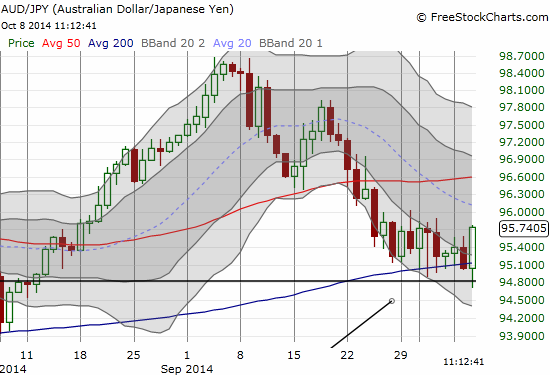
Two last things to point out on the prospects for this bounce. First, the Australian dollar versus the Japanese yen (AUD/JPY) once again came through as a strong stock market indicator. At the time of writing, this pair even quickly repaired a negative reaction to another poor Australian jobs report.
Second, T2108 is still below 30%. This level must be broken in the next five trading days or so to maintain a bullish outlook for this latest oversold bounce.
On both points, see the last T2108 Update for more details.
I conclude with two charts telling much different stories as another demonstration of how I prefer to remain flexible on a stock-by-stock basis even as I am bullishly focused on SSO call options during the oversold periods.
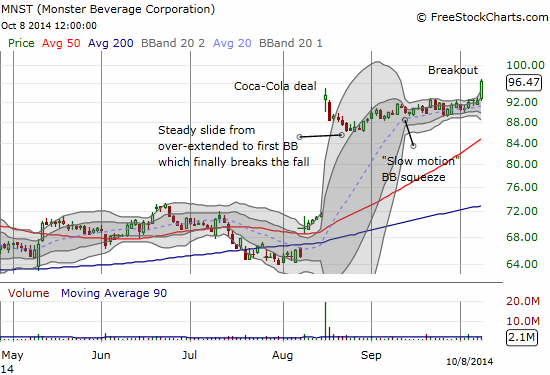
Monster Beverage (MNST) is finally breaking out, closing at a fresh all-time high. I have noted this trade several times. Stubborn persistence paid off bigtime here. Regular readers may recall that I did not want to give up on this trade specifically because the technicals suggested to me follow-through would eventually arrive. And here it is…
On the bearish side, I remain skeptical of Splunk (SPLK). I wrote more on the stock in “Splunk: An Insider Bonanza.” The 200DMA has served as stiff resistance despite at least two analyst upgrades, one of which created a false breakout. SPLK sunk initially despite the upgrade today, so I have to assume that its recovery was almost all due to the general market rally. I consider it very bearish that SPLK first failed to hold gains above a critical technical level and then failed to show gains immediately after an upgrade. I am now hedged with call options though given the possibility that some kind of upgrade cycle for analysts is occurring.
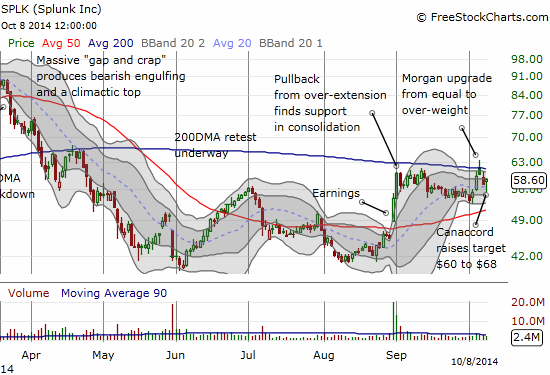
I am also on alert as the 50DMA is turning upward for SPLK. The timer has officially started ticking on this trade. Stay tuned on the potential drama building here!
Daily T2108 vs the S&P 500
")
Black line: T2108 (measured on the right); Green line: S&P 500 (for comparative purposes)
Red line: T2108 Overbought (70%); Blue line: T2108 Oversold (20%)
Weekly T2108

*All charts created using freestockcharts.com unless otherwise stated
The T2108 Resource Page
Expanded daily chart of T2108 versus the S&P 500
Expanded weekly chart of T2108
Be careful out there!
Full disclosure: long SSO call options, long UVXY put options, long MNST call options, long CAT put options, short SPLK and long SPLK call options