
(T2108 measures the percentage of stocks trading above their respective 40-day moving averages [DMAs]. It helps to identify extremes in market sentiment that are likely to reverse. To learn more about it, see my T2108 Resource Page. You can follow real-time T2108 commentary on twitter using the #T2108 hashtag. T2108-related trades and other trades are posted on twitter using the #120trade hashtag)
T2108 Status: 60.0%
VIX Status: 13.8
General (Short-term) Trading Call: Short (fade rallies); third day of an oversold rally should deliver best fading opportunities
Active T2108 periods: Day #192 over 20%, Day #41 over 50%, Day #1 over 60% (overperiod), Day #4 under 70% (underperiod)
Reference Charts (click for view of last 6 months from Stockcharts.com):
S&P 500 or SPY
SDS (ProShares UltraShort S&P500)
U.S. Dollar Index (volatility index)
EEM (iShares MSCI Emerging Markets)
VIX (volatility index)
VXX (iPath S&P 500 VIX Short-Term Futures ETN)
EWG (iShares MSCI Germany Index Fund)
CAT (Caterpillar).
Commentary
Whatever the Fed said in the minutes for its last meeting on monetary policy seems to have provided the market much needed relief. Briefing.com identified this passage as the key catalyst:
“A number of participants noted the overall upward shift since December in participants’ projections of the federal funds rate included in the March SEP, with some expressing concern that this component of the SEP could be misconstrued as indicating a move by the Committee to a less accommodative reaction function. However, several participants noted that the increase in the median projection overstated the shift in the projections. In addition, a number of participants observed that an upward shift was arguably warranted by the improvement in participants’ outlooks for the labor market since December and therefore need not be viewed as signifying a less accommodative reaction function. Most participants favored providing an explicit indication in the statement that the new forward guidance, taken as a whole, did not imply a change in the Committee’s policy intentions, on the grounds that such an indication could help forestall misinterpretation of the new forward guidance.”
This is a very convoluted way of indicating that the Fed still wants to prevent the market from getting too eager in the anticipation of higher interest rates. This reference apparently generated relief to the market’s over-reaction to Chair Janet Yellen’s implicit estimate that the first hike could come as soon as early 2015. Magically, today’s rally brought the S&P 500 right back to where it opened ahead of the last Fed meeting.
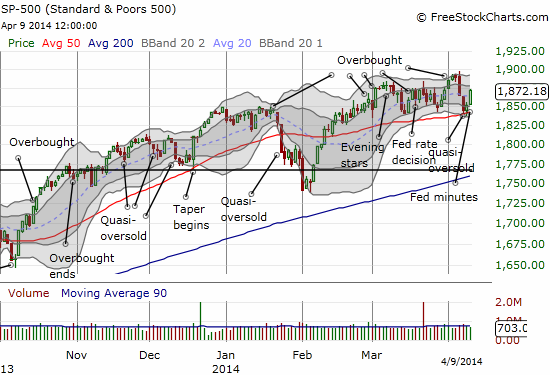
The market closed at its high of the day, a very bullish move. T2108 returned to 60%. The VIX got crushed by 7.2% and decisively sank below the 15.35 pivot. The NASDAQ also closed at its highs on the day. With the NASDAQ still below its 50-day moving average (DMA), I went back into fade mode. I opened up a first tranche of puts on QQQ and shorted SMALL shares on some (former?) high-flyers like Tesla (TSLA) and Google (GOOG). These trades could be a bit early given it is just day #2 into the bounce from quasi-oversold conditions. If this is just a relief rally, I would expect a 3-day duration. But nothing is certain, and I want a position in place just in case things turn around before I can get a more ideal position.
Traders should not be surprised that this oversold bounce has generated some big moves in the momentum stocks that have been the focus of recent selling. I cannot go through all the interesting charts, but here are a few key ones.
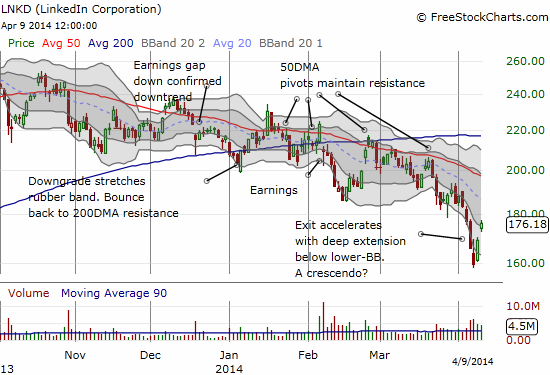
LinkedIn (LNKD) took an extra day, but it did bounce strongly from an over-extension below its lower-Bollinger Band (BB). It almost erased all its losses from the last two days of selling. I took this as an opportunity to lock in profits on call options. I am still holding shares since I think at anytime LNKD in could soar back to 50DMA resistance. Note that today’s close took the stock right to the edge of the first BB which has defined the recent acceleration of the downtrend.
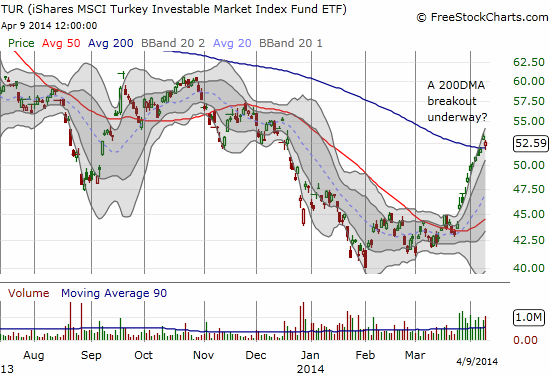
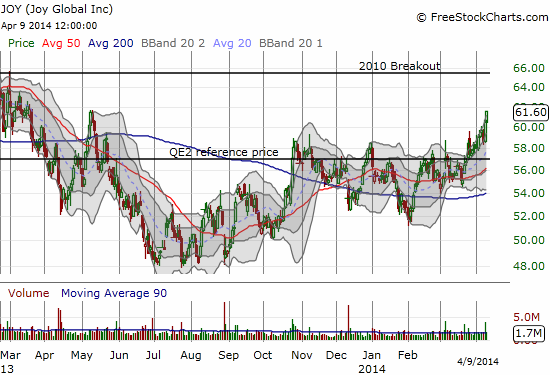
I wish I could write a separate piece on commodities and commodity-related stocks. along with emerging market stocks, they are showing an eerie amount of strength right now. Is it Chinese re-stimulus? Is there a genuine pick-up in the global economy? Either explanation could completely upset the hopes of bears…and ruin my hopes for true oversold conditions for motivating me to load up on “cheap”(er) stocks. The charts below show the dramatic turnaround in the ETF for Turkey (TUR) that has accompanied the continued resurgence of the Turkish lira against the U.S. dollar (USD/TRY). I wish I had never closed out my short USD/TRY position! TUR is followed by mining equipment maker Joy Global (JOY). JOY caught my interest in late March when it broke out again above its QE2 “reference price.”
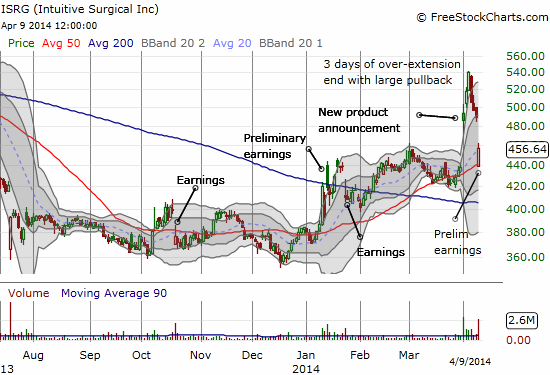
Intuitive Surgical (ISRG) continues its roller coaster ride. This time early guidance disappointed the market. At some point, I will write a follow-up to my January piece on ISRG. The stock’s on-going volatility has earned it a high spot on my trading radar. My last chart review on ISRG pointed out how it was over-extended above its upper-BB. It took another two days for the overbought conditions to finally exhaust themselves. The tumble was dramatic. Anyone who bought into the gap up on ISRG’s product announcement is now quite disappointed with the stock’s complete roundtrip. Note the picture-perfect bounce off 50DMA support. I am kicking myself that I took profits too quickly on my short position and kicking myself harder that I was not ready to buy ISRG at the 50DMA.
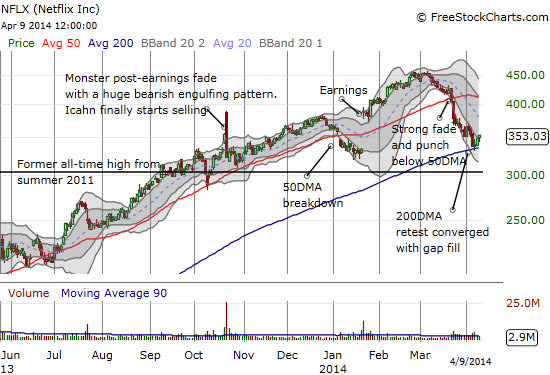
I was prepared for Netflix (NFLX) though. It bounced almost perfectly off the support I pointed out earlier with the 200DMA converging on a gap fill. I moved quickly on the initial dip today to open a call spread. I am not nearly as confident as my last two trades on NFLX that I have described here because I think NFLX could easily fall victim to a return to selling of over-valued/momentum stocks. But I could not resist this trade given NFLX’s extremely bullish setup with the earnings gap up in January. Earnings are coming again April 21st after market hours. My call spread expires a month later. Along with LNKD, NFLX is the kind of stock that could benefit tremendously from a rekindling of interest in high-octane stocks. Stay tuned…
Daily T2108 vs the S&P 500
")
Black line: T2108 (measured on the right); Green line: S&P 500 (for comparative purposes)
Red line: T2108 Overbought (70%); Blue line: T2108 Oversold (20%)
Weekly T2108

*All charts created using freestockcharts.com unless otherwise stated
Related links:
The T2108 Resource Page
Expanded daily chart of T2108 versus the S&P 500
Expanded weekly chart of T2108
Be careful out there!
Full disclosure: long SSO puts, long AAPL shares and call options, long NFLX call options, long JOY call options, long LNKD shares, long QQQ put options, short GOOG and TSLA