(T2108 measures the percentage of stocks trading above their respective 40-day moving averages [DMAs]. It helps to identify extremes in market sentiment that are highly likely to reverse. To learn more about it, see my T2108 Resource Page. You can follow real-time T2108 commentary on twitter using the #T2108 hashtag. T2108-related trades and other trades are posted on twitter using the #120trade hashtag)
T2108 Status: 60.6%
VIX Status: 13.5 (driving back toward 7-year lows)
General (Short-term) Trading Call: Hold – if bullish, you can play the breakout with a stop below today’s low.
Reference Charts (click for view of last 6 months from Stockcharts.com):
S&P 500 or SPY
SDS (ProShares UltraShort S&P500)
U.S. Dollar Index (volatility index)
VIX (volatility index)
VXX (iPath S&P 500 VIX Short-Term Futures ETN)
EWG (iShares MSCI Germany Index Fund)
CAT (Caterpillar)
Commentary
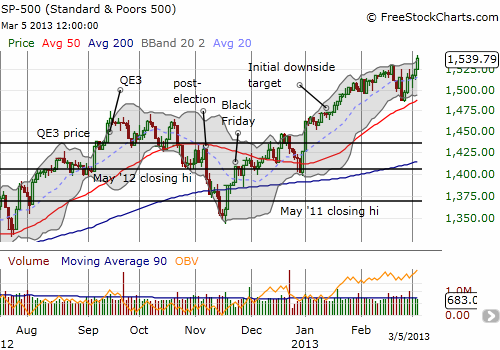
The genie is out of the bottle again. In what looks like a fresh uncorking, the S&P 500 (SPY) raced to new 5 1/2 year highs today. The Dow Jones Industrial Average (DIA) made a new all-time high, but I do not follow this index as it is not representative and antiquated (mainly used as a psychological barometer since it is reported in the media as THE stock market). This whole episode since the March, 2009 lows will likely go down as one of the strongest examples ever of “don’t fight the Fed.” To me, the market has a surreal look and feel that is lulling fresh buyers in an “effort” to gain higher ground before the next correction (which will assuredly come sooner than later). In the meantime, I must respect the price action. It is decidedly bullish, and those wishing to jump in at these levels can use today’s low as a tight stop. (My last round of SSO puts will surely expire worthless next week).

The bearish signals I duly noted for last Friday’s trading are essentially and effectively rendered null and void with today’s move. The Australian dollar continues its sharp rebound, the VIX is getting pushed back toward 7-year lows again, the yen is weakening again, and, most importantly, T2108 looks like it is now going to play catch up with the S&P 500. I now revert to a very neutral stance and will wait for T2108 before making another definitive move. I am now projecting new overbought conditions within a week, perhaps by this Friday. And if historical patterns hold up, the correction after the next overbought period should be relatively large.
Note carefully that I am NOT recommending being stubbornly bearish. That is the wrong reaction to a stubborn rally. The market is telling us that it does not care about the things that may concern us right now. Moreover, note that at some point, a major stock market index MUST make new highs; it MUST make new all-time highs; and it must continue doing so for some duration. Otherwise, progress cannot be made. This is why new highs must be respected. It could signal that the market is ready to leave the past behind and establish a new regime, or level, of trading. I doubt the stock market is embarking on such an adventure here, but I must respect the non-zero probability that a powerful genie has been uncorked and unleashed!
Fortunately, T2108 will be just as useful in a new regime of higher trading levels as in the previous regime. T2108 is just relative to moving averages and does not depend on where the stock market sits relative to arbitrary historical points.
I end with this chart that I captured from today’s Fidelity Investor conference called Inside Out. I believe this is an annual conference. It shows that if current patterns hold, this year will deliver the largest flow of funds into equity mutual funds since the last bull market. We are not yet at a point where funds are running from bonds into stocks. IF such a thing ever happens, look out!

Source: Fidelity
Daily T2108 vs the S&P 500

Black line: T2108 (measured on the right); Green line: S&P 500 (for comparative purposes)
Red line: T2108 Overbought (70%); Blue line: T2108 Oversold (20%)
Weekly T2108

*All charts created using freestockcharts.com unless otherwise stated
Related links:
The T2108 Resource Page
Expanded daily chart of T2108 versus the S&P 500
Expanded weekly chart of T2108
Be careful out there!
Full disclosure: long VXX shares and puts, long SSO puts, short AUD/USD, EUR/AUD, and GBP/AUD

I think there are powerful forces that want Mar 13 puts to expire worthless and they have a credit card from the fed. And the algos NEED 1575 so they can cash out and turn around. Can we hit 1575 next week? It would be a fitting/absurd/predictable/centrally managed place to cap the rally.
I will be watching closely. Thanks for reminding me that options expiration next week could provide a turning point. Very fitting then to have T2108 hit overbought and stay that way into expiration!