(T2108 measures the percentage of stocks trading above their respective 40-day moving averages [DMAs]. It helps to identify extremes in market sentiment that are highly likely to reverse. To learn more about it, see my T2108 Resource Page. You can follow real-time T2108 commentary on twitter using the #T2108 hashtag. T2108-related trades and other trades are posted on twitter using the #120trade hashtag)
T2108 Status: 75.6% (23rd overbought day)
VIX Status: 14.7
General (Short-term) Trading Call: Initiate small short position if holding none yet, sell some longs if have not sold yet.
Reference Charts (click for view of last 6 months from Stockcharts.com):
S&P 500 or SPY
SDS (ProShares UltraShort S&P500)
U.S. Dollar Index (volatility index)
VIX (volatility index)
VXX (iPath S&P 500 VIX Short-Term Futures ETN)
EWG (iShares MSCI Germany Index Fund)
CAT (Caterpillar)
Commentary
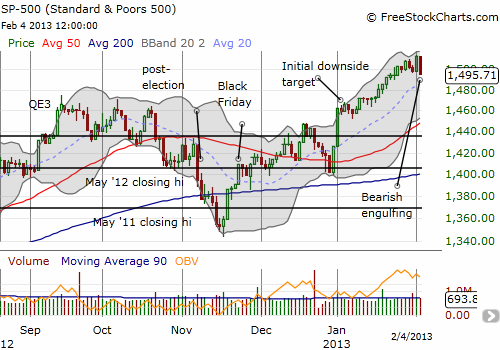
Last Friday, I listed two confounding factors to my refreshed bearish take on the S&P 500 (SPY): the jobs numbers and the typical rallies we see on the first trading day of the month. Since the jobs number seemed like the same old story, I will attribute the 1.0% pop to the first of the month trade. Surely, the subsequent sell-off on Monday that completely erased those gains and then some suggest that the jobs numbers have already been long forgotten. The 1.2% plunge leaves the S&P 500 with its second topping pattern since September. This time, the S&P 500 has printed an even more ominous bearish engulfing pattern off 52-week and multi-year highs.

The GOOD side of this topping pattern is that it once again provides a clear buying signal (for momentum traders anyway) if (when?) the S&P 500 breaks to fresh highs again. The S&P 500 finally broke the intra-day high that marked the top of September’s triple top on January 17, 2013, and the index traded straight up from there. The same will likely happen if the bulls battle back from the bearish engulfing pattern. In the meantime, this bearish pattern must be respected for the sell signal that it represents.
The VIX soared 13.7% to affirm the bearishness of Monday’s trading. However, the VIX remains below the critical 15.2 level (which also happens to coincide with the 50DMA for the VIX), and until it breaks through that level, it does not make sense to get overly bearish.
Finally, T2108 added its vote to the bearish tone by trading to its lowest level since this overbought period began (recall that the overbought period started at the lofty level of 77.4%).
(Also see my take on the weakening Australian dollar as a leading indicator for weakening stocks. So far, so good. “With A Rate Decision Looming, Weakening Australian Dollar Sends Poor Signal For Stocks.”)
As a reminder, here are the trading rules I established in the last T2108 Update for dealing with this critical juncture in the overbought period:
- Absolutely do NOT chase this rally upward from here.
- If the next dip lands on natural support (like the 20DMA around 1480) without ending the overbought period, then there is a low risk opportunity to buy the dip. A stop should be placed directly below support.
- IF and ONLY IF the overbought period hits its 24th trading day or so, then traders should get more aggressive buying dips (and selling quick) as long as the S&P 500′s return remains well below the expected maximum return based on the historical data. (I will try to keep tabs on that number as we go forward, but you should directly reference the chart in the analysis.)
We have a definitive confirmation on rule #1. We are a hair away from testing out #2, and rule #3 could perfectly coincide with #2. Eyeballing the chart from my analysis of overbought periods, the expected maximum return at this point in the overbought period is about 6 or 7%. The S&P 500 is back to a 2.3% return since the overbought period began.
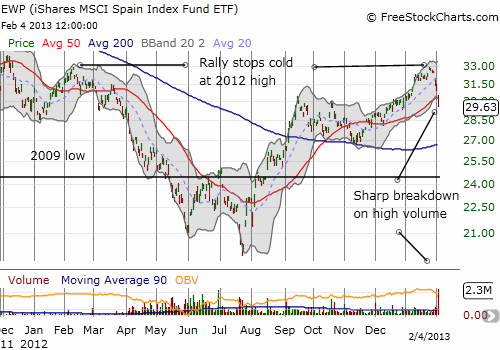
Whatever happens, I have decided to just hold onto my SSO puts. The stirrings in Europe that presumably unnerved markets could quickly flare into something bigger, and I want to have some bearish bets in place just in case. Last week I tweeted that it seemed iShares MSCI Spain Index (EWP) had topped given its rally appeared to stop cold at the highs from 2012. I promptly bought April puts. The reward is already here with a VERY bearish breakdown below the 50DMA on high volume. At the current pace and ferocity, EWP could easily retest the 200DMA within a week or two.

Seeing this action prompted me to review how my favorite play on Europe is doing: Siemens Atkins (SI). SI has also broken down below its 50DMA but the bullish breakout line from 2010 (and coincidentally the same point in Dec, 2012) has not yet broken.

I decided it made sense to buy March calls on SI as a small hedge. Just like the T2108 trading rules for an overbought period, the idea here is to sell at my first opportunity. If I am fortunate enough on a rally, the profits from the SI calls will pay for most if not all the cost of the EWP puts. The differential in expiration months are on purpose. The April expiration for EWP puts allows for time for the fresh bearish signals from Europe to unfold. The March expiration for the SI calls is an attempt to save on premium since I am only betting on a quick relief rally and not on a sustained move.
OK. Now back to the S&P 500. The 20DMA for the S&P 500 is now at 1485. I will buy a few SSO calls anytime starting Tuesday once (if?) that support gets tested. As the rules dictate, I will be selling those calls at the very first opportunity I get to do so. Again, the S&P 500 does not exit the current bearish territory until closes at fresh 52-week highs. Note as well that at the current pace, the overbought period could end Tuesday or Wednesday. That would force me to pull out yet another rulebook: “Trading the S&P 500 After An Overbought Period Ends – Using the Percentage of Stocks Trading Above Their 40DMAs (“T2108″)“. As always, I will take this one step at a time…
Daily T2108 vs the S&P 500

Black line: T2108 (measured on the right); Green line: S&P 500 (for comparative purposes)
Red line: T2108 Overbought (70%); Blue line: T2108 Oversold (20%)
Weekly T2108

*All charts created using freestockcharts.com unless otherwise stated
Related links:
The T2108 Resource Page
Expanded daily chart of T2108 versus the S&P 500
Expanded weekly chart of T2108
Be careful out there!
Full disclosure: long VXX shares and puts, long SSO puts, long EWP puts, long SI calls
