(T2108 measures the percentage of stocks trading above their respective 40-day moving averages [DMAs]. It helps to identify extremes in market sentiment that are highly likely to reverse. To learn more about it, see my T2108 Resource Page. You can follow real-time T2108 commentary on twitter using the #T2108 hashtag. T2108-related trades and other trades are posted on twitter using the #120trade hashtag)
T2108 Status: 79.0% (20th overbought day)
VIX Status: 14.3
General (Short-term) Trading Call: Initiate small short position if holding none yet, sell some longs.
Reference Charts (click for view of last 6 months from Stockcharts.com):
S&P 500 or SPY
SDS (ProShares UltraShort S&P500)
U.S. Dollar Index (volatility index)
VIX (volatility index)
VXX (iPath S&P 500 VIX Short-Term Futures ETN)
EWG (iShares MSCI Germany Index Fund)
CAT (Caterpillar)
Commentary
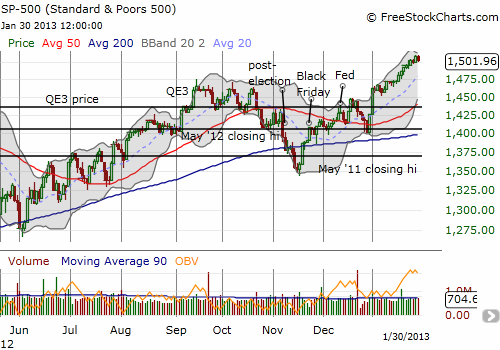
In the last T2108 Update, I listed out a bunch of red warning flags that appear to be shining as bright as ever to me. Today, T2108 flashed its first hint of slowing momentum as it dropped below 80% for the first time since day #2 of this now 20-day long overbought period. Mind you – the nearly uniform uptrend that has dominated the S&P 500 most of this month has not yet broken, but it is closer than ever.

Based on my last study of trading within overbought periods, this one is finally at the point where buying the dips becomes the dominant strategy over looking for a spot to short. The S&P 500 has logged a 2.7% gain since the close on January 2nd when it first traded into overbought territory. This places the S&P 500 right in the middle of the range of maximum returns for overbought periods of comparable length. This means the odds remain high that the overbought period will soon end. However, the overbought analysis also shows that the longer the overbought period lasts from here, the odds of much higher maximum returns increasing rapidly. If the overbought periods churns on from here there is also downside risk for the moment when the overbought period finally does end. Specifically, here are the trading implications:
- Absolutely do NOT chase this rally upward from here.
- If the next dip lands on natural support (like the 20DMA around 1480) without ending the overbought period, then there is a low risk opportunity to buy the dip. A stop should be placed directly below support.
- IF and ONLY IF the overbought period hits its 24th trading day or so, then traders should get more aggressive buying dips (and selling quick) as long as the S&P 500’s return remains well below the expected maximum return based on the historical data. (I will try to keep tabs on that number as we go forward, but you should directly reference the chart in the analysis.)
In other news, the volatility index, the VIX, pushed upward a healthy 7.6%. It is now within an “arm’ length” of a critical test of the 15 level. Needless to say, I think this bounce off the recent bottom will hold. As a hedge, I bought back into some VXX puts yesterday.
Two big confounding factors for this analysis: the U.S. jobs report on Friday (Feb 1st) and the typical rally the market displays on the first trading day of the month (Feb 4th).
Daily T2108 vs the S&P 500

Black line: T2108 (measured on the right); Green line: S&P 500 (for comparative purposes)
Red line: T2108 Overbought (70%); Blue line: T2108 Oversold (20%)
Weekly T2108

*All charts created using freestockcharts.com unless otherwise stated
Related links:
The T2108 Resource Page
Expanded daily chart of T2108 versus the S&P 500
Expanded weekly chart of T2108
Be careful out there!
Full disclosure: long VXX shares, long AAPL shares and call spread, long SSO puts, long TLT puts
