(T2108 measures the percentage of stocks trading above their respective 40-day moving averages [DMAs]. To learn more about it, see my T2108 Resource Page. You can follow real-time T2108 commentary on twitter using the #T2108 hashtag. T2108-related trades and other trades are posted on twitter using the #120trade hashtag)
T2108 Status: 73.9% (first day of a new overbought period)
VIX Status: 16.7
General (Short-term) Trading Call: Reduce longs, accumulate a “final” bearish position. Going forward, buy the dips.
Reference Charts (click for view of last 6 months from Stockcharts.com):
S&P 500 or SPY
SDS (ProShares UltraShort S&P500)
U.S. Dollar Index (volatility index)
VIX (volatility index)
VXX (iPath S&P 500 VIX Short-Term Futures ETN)
EWG (iShares MSCI Germany Index Fund)
CAT (Caterpillar)
Commentary
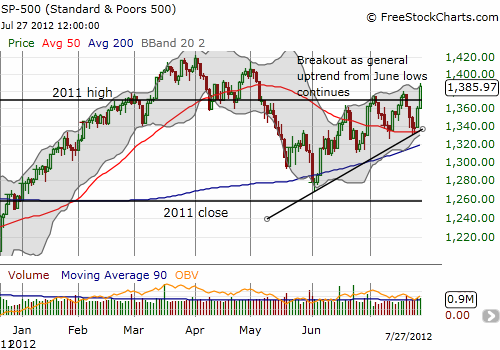
For the third time in a month, T2108 is in overbought territory. The first two overbought periods were “easy” in that they peaked out just above resistance. Accumulated bearish positions became very profitable once the overbought period ended. THIS TIME, I do not think bears will get over so easily. This overbought period begins ABOVE resistance. Moreover, the uptrend from the June low is once again confirmed with this fourth higher high (following three higher lows). In other words, the market is developing a more and more bullish tone.

The challenge of this bullish run is that the only clear buying signal was the oversold reading at the June lows. The next dip did not stop at a clear point of support. The next dip after that DID end at the 50DMA. So with the last dip also finding support at the 50DMA, the case further builds that traders should simply focus on buying the dips going forward.
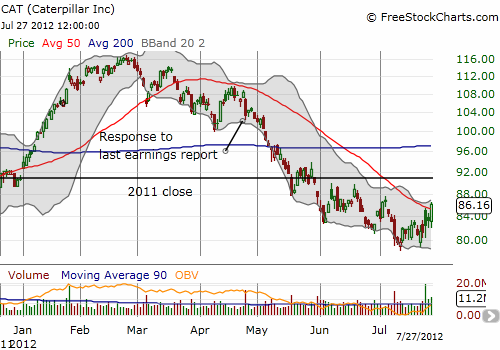
There are other signals that point toward an imminent extended overbought rally. Most importantly, ever since the extended overbought rally that began this year, I have been looking for another such rally given the pattern of history since at least 1986. Secondly, the three months going into a Presidential election featuring an incumbent tend to be very bullish (see “The Positive Trade When Incumbent Presidents Run For Re-Election“). Lastly, Caterpillar (CAT), my favorite “canary in the coal mine”, has FINALLY begun to turn the corner. After fading from its post-earnings gap up on Wednesday, July 25th and then struggling to keep up with Thursday’s market rally, CAT LED the way on Friday with an impressive 3.4% bounce. This surge included a close above CAT’s 50DMA for the first time since March and a new post-earnings high. Buying volume has been very strong. The next milestone to beat is an elimination of the loss on the year.

Despite all these bullish signals, I am still compelled to start this overbought period in bearish fashion with the T2108 rules. The transition from here to a more bullish strategy will be tricky and might seem conflicted and/or confusing! I started a first tranche of SSO puts at the previous resistance at the 2011 high. The next, and last, tranche I will buy will be around 1405. However, in the background, I am building, and sometimes trading, a shopping list of attractive stocks (for example, see earlier posts on JPMorgan Chase (JPM) and Cognizant Technology). Once I switch to a more bullish strategy, I will be aggressively focusing on buying SSO call options.
A skeptic might astutely point out that last summer the S&P 500 also printed a low in June and sprinted ahead in what at the time seemed like a strong recovery into July despite lingering bad news from Europe’s sovereign debt crisis. T2108 hit overbought territory in the early part of that month. There are two key and important differences: 1) July, 2011 delivered a second peak that was lower than the July high, 2) this second peak stopped just short of printing a new overbought period. THIS TIME, the S&P 500 has stubbornly pushed onward and upward: higher highs, higher lows, and a persistent push to return to overbought territory without resting in oversold territory. I am expecting August to firmly confirm or deny the difference. Last year, the market sold off around 13% in just the first week of trading in August…
Daily T2108 vs the S&P 500
Click chart for extended view with S&P 500 fully scaled vertically (updated at least once a week)

Black line: T2108 (measured on the right); Green line: S&P 500 (for comparative purposes)
Weekly T2108

*All charts created using freestockcharts.com unless otherwise stated
Related links:
The T2108 Resource Page
Expanded daily chart of T2108 versus the S&P 500
Expanded weekly chart of T2108
Be careful out there!
Full disclosure: long SDS and SSO puts; long VXX shares; short VXX call spreads; long VXX puts; long CAT
