(T2108 measures the percentage of stocks trading above their respective 40-day moving averages [DMAs]. To learn more about it, see my T2108 Resource Page. You can follow real-time T2108 commentary on twitter using the #T2108 hashtag. T2108-related trades and other trades are posted on twitter using the #120trade hashtag)
T2108 Status: 16.3% (Oversold day #2)
VIX Status: 25.1
General (Short-term) Trading Call: Close more bearish positions. Start NIBBLING on bullish positions – see below for some caveats and conditions! (click here for a trading summary posted on twitter)
Reference Charts (click for view of last 6 months from Stockcharts.com):
S&P 500 or SPY
SDS (ProShares UltraShort S&P500)
U.S. Dollar Index (volatility index)
VIX (volatility index)
VXX (iPath S&P 500 VIX Short-Term Futures ETN)
EWG (iShares MSCI Germany Index Fund)
CAT (Caterpillar)
Commentary
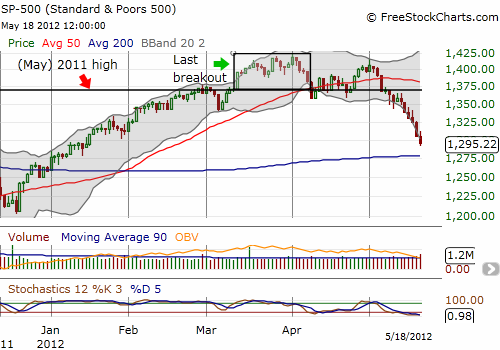
In bear markets, there are no supports, only slippery slopes. The S&P 500’s sell-in-May slide has behaved like a bear market sell-off as it tumbles down its own slippery slope with almost no support. The index is now down to a 3.0% year-to-date gain, turning this year’s three-month, overbought, non-stop rally to double-digit gains into a fading memory. (I believe this is one of the worst performances following such a strong overbought period, but I will need to confirm this observation. I am pretty confident because the Dow’s losing record of 12 of the last 13 sessions is its worst since 1974. Stay tuned!). Support is finally in sight at the 200DMA around 1280 (whittling the year-to-date gain down to 1%).

Note again that stochastics are extremely oversold. This means the index is more likely than usual to reverse suddenly and sharply at any time (just like in November of last year). Combine these stochastics with the second day of an oversold period, and this becomes a terrible time to initiate new bearish positions. Once T2108 hits single digits and/or the volatility index, the VIX, experiences a tremendous surge, say over 10 or 15%, bears should have emptied out just about every short and put that is not hedging another position. Conversely, such an event becomes a great time to SELL high-priced puts on stocks or indices you would like to own and/or to initiate new bullish trades. This scenario is the ideal launching point to play an oversold bounce. In case such a clear-sounding bell never rings, traders should begin scaling into the oversold strategy.
Friday’s trading was more strange than momentous. As I discussed in my previous T2108 Update, I was anticipating a gap down to flush out sellers and pave the way for a good oversold buying opportunity. Instead, the market delivered a classic bear-like fake-out. The morning started slightly up and even strengthened despite the vicious selling that occurred overnight in global markets. It was all downhill from there. I was not able to salvage expiring SSO calls in the morning and another low-ball bid on SSO calls was filled. I sold my VXX calls in the morning, but I certainly was pining after them by the close!
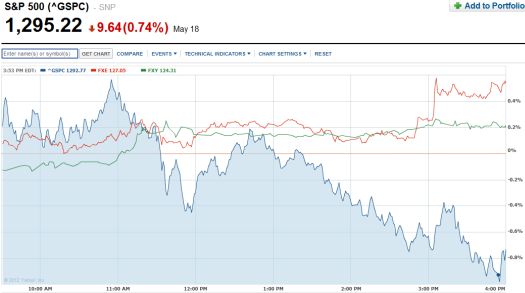
The foreign exchange market added to the strangeness. The euro bounced nicely off overnight lows against all major currencies and even the yen weakened. This seemed to support a positive open for stocks, but there was no real news I could identify to explain the reversal in sentiment. After the S&P 500 index peaked, the yen began strengthening again, yet the euro held steady and even ended the day with a small flourish. I overlay the action in the currency ETFs, FXE (the euro vs. the U.S. dollar) and FXY (the Japanese yen vs. the U.S. dollar) with the S&P 500. FXE increases with strength in the euro versus the dollar (red line) – see the close. FXY increases with the strength in the yen (green line) – see the intraday peak in the S&P 500.

Source: Y!Finance
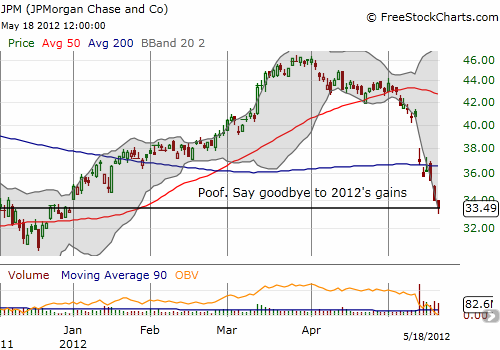
JPMorgan Chaase and Co (JPM) added its name to the growing list of stocks that have given up all their gains for 2012. Plenty has been written about JPM’s trauma. My main fear is that this is just the tip of the iceberg of a whole new set of woes in the financial sector. What other banks are going to surprise us with massive trading or hedging losses? How hard will hedge funds press these institutions to the wall as they smell more and more blood in the water? With Europe weakening yet again, it seems to me we can ill-afford any other stresses in the financial system. I jumped all over (June) puts the day after I wrote my bearish chart review of JPM. I consider this position an important hedge (meaning I feel just fine holding even during the oversold period) and plan to have some on hand throughout the summer until some kind of resolution occurs. (I have no idea what that might look like right now!). I will never forget how slow I was to react to the accelerating collapse of Bear Stearns from 2007 to 2008…

There is every reason to hate the stock market right now. Everywhere I look I see slippery slopes and a lack of support. As traders and investors observe the same things, bearish sentiment will get reinforced. The only thing worse than losing money is to lose hard-earned money. It instills an uncomfortable feeling of being tricked, of having bought into an illusion, of futility even. This will make the growing bearish sentiment harder than usual to shake. The only possible positive catalyst on the horizon will likely be Fed-inspired, especially considering all the stock rallies since the recession have occurred on the heels of forceful Fed action. This means that bad news may start becoming good news as Fed-addicted market participants once again start to talk excitedly about QE3. The Fed will in turn need to keep an eye on Europe and make sure it times any intervention at a point where Europe’s woes will not quickly nullify its efforts. A huge wildcard is the resurrection of fiscal antics in Washington D.C. The market and the economy are more vulnerable than the last time politicians went to battle over the deficit because buyer’s fatigue is likely to beset what few people and traders are still trying to hang around the financial markets. This summer is looking like another gut-wrencher.
(Note – as of May 11, 2012, some glitch in FreeStockCharts.com is screwing up the overlay of the S&P 500 with T2108).
Black line: T2108 (measured on the right); Green line: S&P 500 (for comparative purposes)
Weekly T2108

*All charts created using freestockcharts.com unless otherwise stated
Related links:
The T2108 Resource Page
Expanded daily chart of T2108 versus the S&P 500
Expanded weekly chart of T2108
Be careful out there!
Full disclosure: long SDS, SSO calls, and JPM puts; net long Japanese yen; net short euro


I really appreciate the way you write. It is the most clear and honest financial commentary I have ever seen. Plus, you are right most of the time which is also nice.
My sincere thanks.
You’re welcome and thanks for reading.