(T2108 measures the percentage of stocks trading above their respective 40-day moving averages [DMAs]. To learn more about it, see my T2108 Resource Page. You can follow real-time T2108 commentary on twitter using the #T2108 hashtag. T2108-related trades and other trades are posted on twitter using the #120trade hashtag)
T2108 Status: 18.9% (Oversold day #1, first since Oct 2, 2011)
VIX Status: 24.5
General (Short-term) Trading Call: Start closing bearish positions. Start NIBBLING on bullish positions – see below for some caveats and conditions! (click here for a trading summary posted on twitter)
Reference Charts (click for view of last 6 months from Stockcharts.com):
S&P 500 or SPY
SDS (ProShares UltraShort S&P500)
U.S. Dollar Index (volatility index)
VIX (volatility index)
VXX (iPath S&P 500 VIX Short-Term Futures ETN)
EWG (iShares MSCI Germany Index Fund)
CAT (Caterpillar)
Commentary
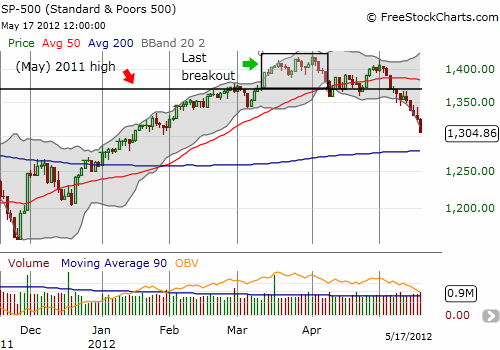
I hope you are wiping out the cobwebs. T2108 has not been officially oversold for seven and a half months. Today, T2108 dropped to 19% as the S&P 500 plunged 1.5% to a 4-month low. It is now up only 3.6% year-to-date after being up as much as 12% or so for the year. It took 3 months to make the high for the year, one month to retest that high (and fail), and, so far, less than three weeks to erase the majority of the year’s gains. Such is life in the stock market.

It is a strange feeling to go from predicting overbought 2 weeks ago to predicting oversold for this week. I was much more confident in the latest forecast because stocks look sooooo ugly almost everywhere I look. I have posted several charts of stocks breaking down in earlier posts. These technicals also make me suspect that this oversold period will last longer than average (or median), or the market will deliver a rapid sequence of short oversold periods.
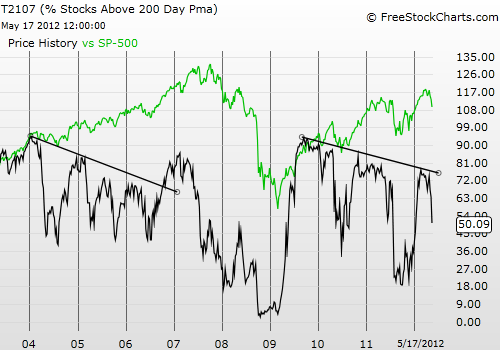
Even T2107, the percentage of stocks trading above their 200DMAs, is sliding fast and furiously, confirming that stocks are losing their uptrends and feeding bearish sentiment. Note the ominous setup in T2107’s chart from a longer-term perspective. Note well how the S&P 500 is able to continue trending upward for years even as its underlying fundamentals erode slowly but surely (the green line in the chart).

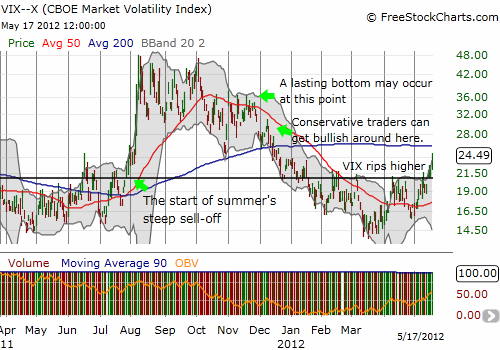
The oversold rulebook is simple. All traders should start closing out bearish trades. Aggressive traders should start building bullish positions (informal rule is to add to positions on spikes in the volatility index). Conservative traders buy once the VIX increases 20 percent from the first oversold day (a rise to 29.8 for this cycle) or buy the first day after the oversold period ends, whichever comes first. I prefer to play the indices for these T2108 trades because individual stocks are not necessarily going to follow the overall pattern. Given the patterns repeating from the last two summers – a top in May and/or a VIX shooting over 21 – I anticipate very short lives for bullish trades (post-oversold period). Only a wash-out kind of day will make me think the market has put in a lasting bottom. This could occur in many ways, but the best for these purposes would be a tremendous spike in the VIX, especially coming at least within 20% of the last spike (a rise to 36.6 for this cycle). I summarize everything in the chart below.

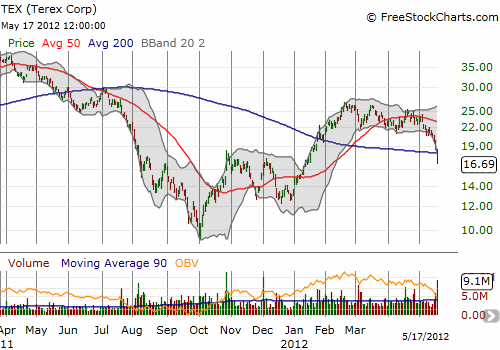
I closed out some of my bearish positions into Thursday’s selling. For example, I sold all my puts in Caterpillar, Inc. (CAT) as it officially wiped out all its gains for 2012. It is now down 3% for the year, and I am very likely to dump my few shares into the next rally. I am still holding the June VXX calls. I am still holding all my SDS (stubborn position!). I sold my Terex (TEX) puts last week – obviously, far too early. Today delivered the big drop (10%!), LONG overdue in my opinion. As a reminder, I consider TEX the poorer cousin of CAT.

I could go on and on with the charts, but time is short! Please stay on the look-out for future chart reviews for trading ideas. There are a LOT of fascinating charts getting printed right now.
Tomorrow (Friday, May 18th) is a HUGE day because it is options expiration, AND the Facebook (FB) IPO rolls out. Here are my best guesses for likely scenarios tomorrow:
- I am thinking a lot of market makers sold puts that expire tomorrow. They have probably been scrambling to hedge and have added to the market’s downward pressure. They should try to jam the market lower right from the open, most likely a gap down. Next, they should quickly unwind those positions, buying back stocks “on the cheap”, in time to sell more into the euphoria over the Facebook IPO.
- If the Facebook IPO goes well, it just might be enough to keep the market motoring into a positive close on the day. I will re-evaluate my trading bias if this scenario plays out.
- If the Facebook IPO goes poorly – that is, sellers begin right from the open and do not stop unloading – then we should count on a very ugly day indeed.
If the market gaps down, aggressive T2108 traders MUST buy at least SOME SSO shares (or even calls), especially if you did not start any positions Thursday. I placed a “lowball” order for June SSO calls, but the market closed with the bid sitting on my order…unfilled. If we somehow gap up tomorrow, I will of course be very disappointed, but I do have some SSO calls expiring tomorrow that should be salvageable. How could we possibly gap up? Well, global markets are going to get a total of about 12-14 hours to absorb all the negativity from Thursday and the entire week (or two!). It is easily possible that the selling and bearishness simply exhausts itself by the time the U.S. market opens (the Nikkei closed down 3% after gapping down 1.7% – yikes!). If the foreign exchange markets deliver a major bearish move before the U.S. open, I will bet THAT move will carve out a springboard for bullish sentiment to take over for the day. Regardless, I am more inclined to think we get a gap down.
(I will have to save my foreign exchange commentary for another post. Even as I type, market action is very fluid and volatile).
I will end with a dirty analysis of a trade a friend proposed: an SPY straddle using the $131 strike for puts and the $132 strike for calls (SPY closed Thursday at 130.86). The idea is to start delta neutral (meaning that both sides of the trade start with an equal profit/loss potential for the next “incremental” move in the stock). Presumably, implied volatility will rise with an increase in fear and you can profit on the puts while suffering minimal losses on the calls for a net overall profit. If that scenario occurred, I would sell the entire position and be done with it. However, if implied volatility does not help enough, then I would highly recommend selling the puts on the likely gap down scenario and then riding the calls as the T2108 bullish position. Note that I would have strongly preferred this kind of position with T2108 higher; at a higher level there is more room to maneuver and more time to think through reactions to changing market conditions. Good luck, my friend!
(Note – as of May 11, 2012, some glitch in FreeStockCharts.com is screwing up the overlay of the S&P 500 with T2108).
Black line: T2108 (measured on the right); Green line: S&P 500 (for comparative purposes)
Weekly T2108

*All charts created using freestockcharts.com unless otherwise stated
Related links:
The T2108 Resource Page
Expanded daily chart of T2108 versus the S&P 500
Expanded weekly chart of T2108
Be careful out there!
Full disclosure: long SDS; long VXX puts and calls, long CAT shares, long SSO calls

