(T2108 measures the percentage of stocks trading above their respective 40-day moving averages [DMAs]. To learn more about it, see my T2108 Resource Page. You can follow real-time T2108 commentary on twitter using the #T2108 hashtag. T2108-related trades and other trades are posted on twitter using the #120trade hashtag)
T2108 Status: 80% (overbought day #31)
VIX Status: 21
General (Short-term) Trading Call: Close more bullish positions. Begin but do NOT expand an existing bearish position.
Reference Charts (click for view of last 6 months from Stockcharts.com):
S&P 500 or SPY
SDS (ProShares UltraShort S&P500)
U.S. Dollar Index (volatility index)
VIX (volatility index)
VXX (iPath S&P 500 VIX Short-Term Futures ETN)
EWG (iShares MSCI Germany Index Fund)
Commentary
It figures that right after I conclude the market is headed for more upside before the overbought period ends, I start seeing much surer signs of a market top. To prevent adding confusion on top of confusion, I will focus on the negative technical signals in this piece. If you want a review of the statistical case for more upside, please see the T2108 Update from February 13.
The biggest alarm bell rang when Apple (AAPL) plunged at noon on extremely high volume from all-time highs. This drop was concurrent with a similar drop in the general market (SPY). I wrote a chart review specifically dedicated to what I think may be one of the more important technical events we will see for a while. See that post for more details. Bottom-line – I think Apple’s move confirms that the general market’s upward momentum is finally coming to an end for now.
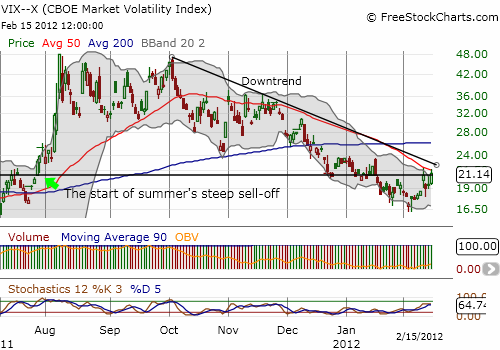
Volatility is hanging tough with its bounce from the bottom. Monday’s complete reversal of Friday’s pop convinced me to write “so much for volatility.” I concluded that volatility would resume its steady drop. Instead, volatility has now bounced right back to Friday’s close. I still find it strange that the S&P 500 is barely budging on this spike in volatility, but now I am assuming the market is just slow in responding. After all, a LOT of complacency has built in this year after 31 straight days of overbought conditions that have lacked any real selling pressure. It will take something jarring to alter behavior in any significant way. The change in volatility now seems to be telling us that catalyst is somewhere around the corner.

I stuck with my earlier plan to buy (March) VXX puts on the next spike in volatility. This position new serves as a hedge against being wrong (again) that something big is in the works. I will sell the puts on the next drop in volatility (assuming one occurs).
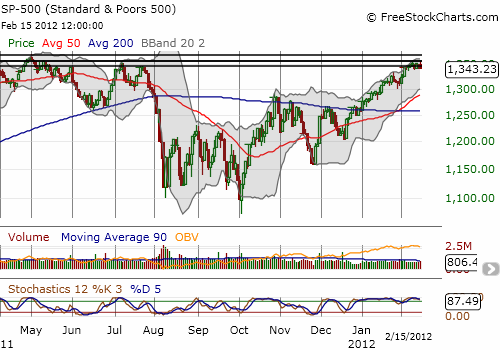
It is no accident that the S&P 500 is struggling to make further gains at these levels. 1345-1355 represents the range on the S&P 500 between peaks in July which in turn were failed retests of (at that time) three-year highs. Every one worth their technical salt is watching these price levels closely to see whether the market fails the test again or somehow manages a breakout to new ground.

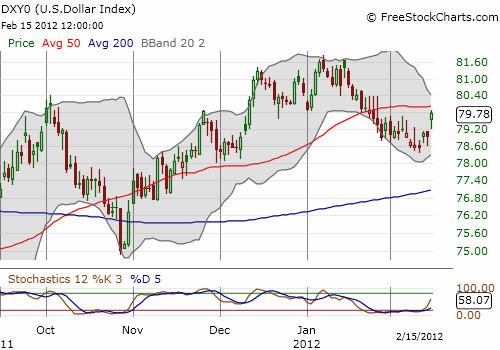
The U.S. dollar is a huge wildcard in this action. After a month biased downward, the U.S. dollar index finally broke out from its downtrend. Renewed weakness in the euro and sudden weakness in the Japanese yen are primary drivers. Combining this renewed dollar strength with a struggle to break to fresh highs combined with volatility resiliently working off its bottom, makes me extremely cautious. The chart below shows the dollar index remains in a bullish position since it is above its 200DMA. If it regains the advantage over its 50DMA, I will have to assume a resumption of the uptrend. This uptrend is not necessarily a bad sign for the markets, but, again, when occurring in combination with other warnings, I get even more cautious.

The bulls finally have a real test ahead of them that may require some extra buying power. The bears have a real opportunity, but it is not clear enough bears remain to tilt the balance over the cliff. I highly suspect we will get an answer within the next week if not less.
Charts below are the latest snapshots of T2108 (and the S&P 500)
Refresh browser if the charts are the same as the last T2108 update.
Black line: T2108 (measured on the right); Green line: S&P 500 (for comparative purposes)
Weekly T2108

*All charts created using freestockcharts.com unless otherwise stated
Related links:
The T2108 Resource Page
Expanded daily chart of T2108 versus the S&P 500
Expanded weekly chart of T2108
Be careful out there!
Full disclosure: long SDS and VXX; long VXX puts and SDS calls

