(T2108 measures the percentage of stocks trading above their respective 40-day moving averages [DMAs]. To learn more about it, see my T2108 Resource Page.)
T2108 Status: 13%.
VIX Status: 32
General (Short-term) Trading Call: Close most bearish positions. Start building bullish positions.
Commentary
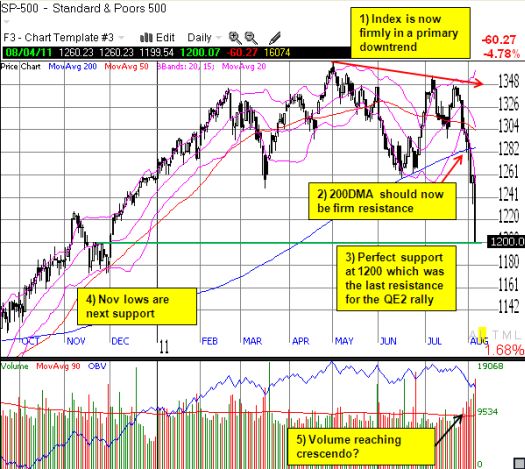
If you have spent the last nine months feeling like you missed out on the Federal Reserve’s QE2-inspired rally, you now get a second chance to play. The S&P 500 experienced an historic plunge of 4.8% to 1200 – a level last seen during the swoon of November, 2010. In fact, at that time, 1200 served as resistance for about two weeks. When resistance caved on December 1 with a 2.1% rally, the market never looked back (see this story I wrote at the time encouraging buys if such a breakout occurred. I also showed the importance of the support/resistance at 1200 for the past several years.).
Last November, fear ran rampant that the Federal Reserve’s QE2 (second round of quantitative easing) would not succeed in inflating the stock market, uh, economy, and a sharp bout of selling followed a sharp rally that started that month (North Korea – remember them? – was also saber-rattling again). With roughly half of all the QE2 gains now erased, you can bet Bernanke and crew are getting a bit more nervous…fingers hovering over the QE3 button right..about…now…

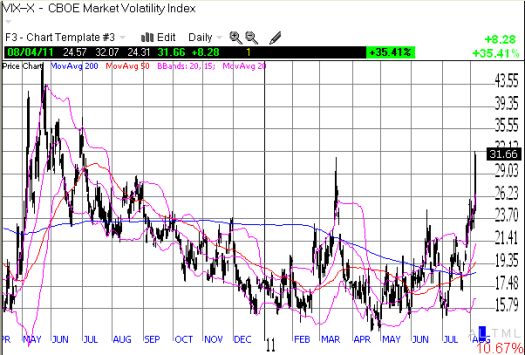
But I am getting ahead of myself with bearishness. More on that later. For now, let’s focus on the short-term positives. T2108 essentially collapsed today: it was sliced in half to 13%. T2108 was last at these deeply oversold levels during last summer’s sell-off. The VIX finally produced a tremendous spike, increasing 35% to 32. This is the VIX’s highest close of the year and represents a 14-month high. These two signals are sending out a screaming buy signal, especially for aggressive traders. Add to this the S&P 500’s plunge well below its lower Bollinger Band, and we get a “rubber band” stretched near its limit just waiting to snap back at any moment.

In response, I closed all my remaining SSO puts and a few other short positions. I had to gulp hard and take a deep breath though as today’s market was so ugly it only a tradebot could view the carnage without feeling pain. I executed several bullish trades, including buying some SSO shares and calls. EWZ, the iShares MSCI Brazil Index Fund ETF, finally registered a 20% correction from its 52-week highs, so I bought some in keeping with my “20% rule” for EWZ. EWZ is now at 13-month highs (see chart here). I even bought a very speculative call in Siemens Aktien (SI) which dropped to 8-month lows today (see chart here).
(Note that I posted almost all my trades on twitter using my #120trade hashtag. Also see @drduru.)
The list of potential buying candidates is so long and so tempting that I definitely find myself in a classic Warren Buffet moment: I am feeling greedy just as so many are feeling abject fear. As you know from my previous T2108 updates this week, I maintained skepticism about the bullish opportunities because I had not seen the fear I would expect under these trading conditions. (It turns out that the CBOE equity put/call ratio did spike back to recent highs yesterday, so, technically the fear was finally showing up yesterday – this indicator is hard to use for day-to-day trading given the one day delay).
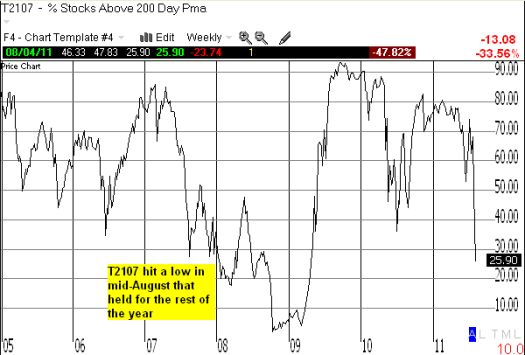
If you are still not convinced that the market is at must-buy oversold extremes, let’s review the T2107, the percentage of stocks trading above their respective 200DMAs. Actually, let’s review it regardless: while in the short-term, T2107 provides the oversold icing on the cake, it also confirms a bearish longer-term outlook that I flagged back in June. I basically used T2107 to point out a parallel with 2007’s market that suggests the S&P 500 will deliver one more rally in the Fall. After this rally, a more extended correction (new bear market?) should follow.
T2107 dropped from 39% to 26% to an amazing 27-month low. Only bear market type of selling can push T2107 much lower than these levels.

In summary, I am very bullish in the short-term and expect an imminent bounce that could be quite strong. I also expect the 200DMA to provide stiff overhead resistance for the first rally attempt, so I will not be interested in holding new bullish trading positions for extended periods of time. If the S&P 500 manages a close above the 200DMA, I will prepare for a strong bullish rally which could very well be the last we see for an extended period of time. As usual, T2108 will help steer me in the short-term.
Note that I am VERY torn about a more bearish longer-term outlook given my fundamental bullishness in commodities. You will likely see this struggle play out in future posts as I bounce between technicals and fundamentals.
Charts below are the latest snapshots of T2108 (and the S&P 500)
Refresh browser if the charts are the same as the last T2108 update.
Daily T2108 vs the S&P 500

Black line: T2108 (measured on the right); Red line: S&P 500 (for comparative purposes)
Weekly T2108

*All charts created using TeleChart:

Related links:
The T2108 Resource Page
Expanded daily chart of T2108 versus the S&P 500
Expanded weekly chart of T2108
Be careful out there!
Full disclosure: long shares and calls on SSO; long puts on VXX, long EWZ, long SI calls
