(T2108 measures the percentage of stocks trading above their respective 40-day moving averages [DMAs]. To learn more about it, see my T2108 Resource Page.)
T2108 Status: 36%.
VIX Status: 23.0
General (Short-term) Trading Call: Hold. Start identifying potential longs.
Commentary
Blink and you may have missed it. T2108 just went from invalidating my forecast of hitting the lows 30s, to scraping at the margins of overbought conditions, and tumbling back down to a July low right next to my original forecast in 5 trading days. In the middle of that action, AAPL closed above $400 yesterday only to drop 2.7% (as a reminder, AAPL’s bullish streak has kept me from getting overly bearish). This journey has kept me on my toes.
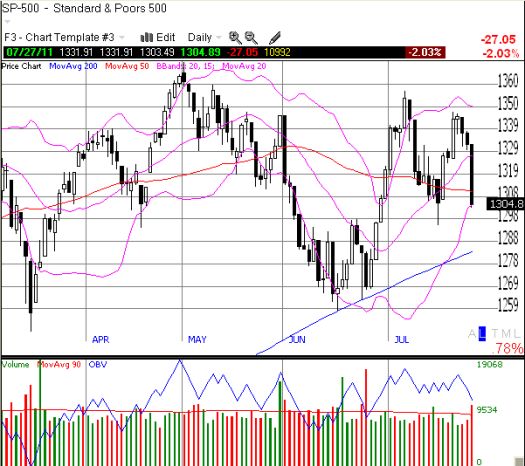
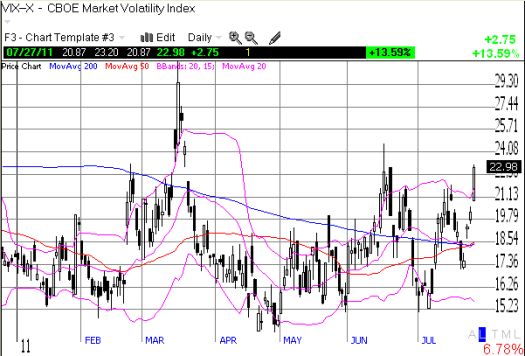
T2108 steeply plunged today from 58% to 36%. The S&P 500 lost 2%. The VIX closed at a 4-month high. Clearly, my original forecast is back in play. Charts below:


I have gained several potential lessons from the recent action:
- “Close enough” to overbought can easily be “good enough.”
- Do not let one individual stock distract from the overall message of the market (in my case, T2108 and its various accomplices).
- The VIX can create bearish divergences with T2108 when the VIX is at levels last seen during a recent oversold period yet T2108 is not yet oversold.
Using lesson #3 above, I have to assume that T2108 will drop to the low 30s as early as tomorrow given the VIX is now at 4-month highs. In the trading call, I am advising building a list of potential longs because once T2108 approaches 30%, and especially if it gets to official oversold levels at 20%, the VIX may already be spiking high enough to warrant initiating fresh bullish trades. Note this is a different approach than the standard rules I have establish for trading oversold conditions:
“Lower risk tolerance (conservative trader): buy once [the] VIX increases 20 percent from the first oversold day or buy the first day after the oversold period ends, whichever comes first.
Higher risk tolerance (aggressive trader): buy on the first oversold day, recognizing that 56 percent of all oversold periods last only one or two days. This strategy eliminates dependence on [the] VIX.
Traders with moderate risk tolerances can combine these strategies by allocating an appropriate amount of capital to each approach.”
I may have been pre-mature, but I used today’s drop in AAPL to finally initiate a small position (a Jan 2012 430/435 call spread). Given the expiration 6 months from now, this is clearly not a short-term trade. I fully expect AAPL to approach these levels at some point between now and then, likely during the next overbought period in the stock market. If I were being more conservative I would have made AAPL “prove” itself by achieving another close above $400 first.
Charts below are the latest snapshots of T2108 (and the S&P 500)
Refresh browser if the charts are the same as the last T2108 update.
Daily T2108 vs the S&P 500

Black line: T2108 (measured on the right); Red line: S&P 500 (for comparative purposes)
Weekly T2108

*All charts created using TeleChart:

Related links:
The T2108 Resource Page
Expanded daily chart of T2108 versus the S&P 500
Expanded weekly chart of T2108
Be careful out there!
Full disclosure: long puts on SSO, long SDS, long AAPL call spread
