(T2108 measures the percentage of stocks trading above their respective 40-day moving averages [DMAs]. To learn more about it, see my T2108 Resource Page.)
T2108 Status: 20% and oversold
General (Short-term) Trading Call: Cover more shorts, add more longs
Commentary
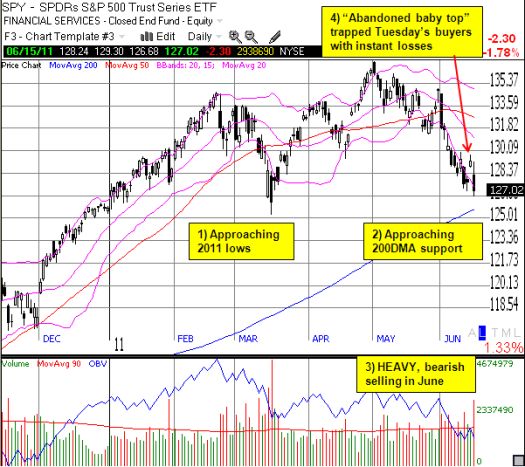
T2108 plummeted to oversold territory. The indicator closed right at 20%. Since the March, 2009 lows, the stock market has only reached these oversold levels in May and June of last year. The S&P 500 dropped 1.7% as it reached for the dual support levels of the March lows and the 200-day moving average (DMA).
I use the SPY to show the action on the S&P 500 because it more clearly shows the true open of the market. The chart shows exactly why I dreaded the prospect of a gap-down this time and validates my expectation that such a plunge would likely wipe out all of Tuesday’s gains.
The SPY formed an “abandoned baby top” where the market gaps up one day and gaps down the next and reverses most, if not all, of the previous gains. It traps buyers who bought into the rally and turns them into panicked sellers the next day. This is a very bearish pattern when it is at or near the top of an uptrend. Its significance in the middle of a steep downtrend is not so clear. However, this pattern provides a great line of resistance above which we can assume the bulls are reasserting control of the market.

Now, things go from “interesting” to “hard.” The stock market is oversold, but we cannot know how much more oversold it will get before bottoming. We manage risk by continuing to cover shorts and judiciously buying longs. This period will come to an end sooner or later and, moreover, can lead to a sustained (relief) rally.
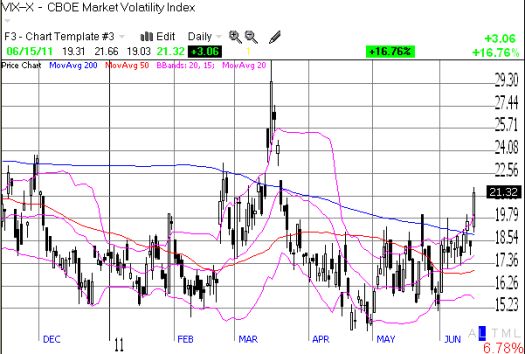
I have done analysis in the past on timing buys in oversold periods. I use the volatility index (VIX) to provide additional clues. In 2008, I wrote “Does the VIX Need to Spike at A Climactic Low?“, and I concluded that a “good enough” rule of thumb is to buy when the VIX gets within 20% of the last spike. At the 2011 lows in March, the VIX got as high as 31. A move to 25 gets the VIX within 20% of that spike; it is at 21 now. Such a move would certainly push the S&P 500 through the 200DMA and past the lows for the year. The drop could get steep as stops get taken out, and a rebound could be swift and sharp as buyers move into the vacuum left by the weaker hands.

This “20% rule” is incomplete because the VIX may not get as high as 20% from the previous spike. Last year I updated my T2108 vs VIX study with an article in Stocks, Futures and Options (SFO) Magazine called “Trade the Oversold Bounce” (free subscription required). In that piece, I developed more sophisticated rules for speculating on bottoms:
“Lower risk tolerance (conservative trader): buy once [the] VIX increases 20 percent from the first oversold day or buy the first day after the oversold period ends, whichever comes first.
Higher risk tolerance (aggressive trader): buy on the first oversold day, recognizing that 56 percent of all oversold periods last only one or two days. This strategy eliminates dependence on [the] VIX.
Traders with moderate risk tolerances can combine these strategies by allocating an appropriate amount of capital to each approach.”
Given the proximity of clear support lines, I am putting myself mostly in the mode for higher risk tolerance.
My early trade in Bank of America (BAC) has all but evaporated. Such are the risks of speculation. Interestingly enough, the June 11 calls continue to attract high volume although total money exchanged is naturally dropping fast.
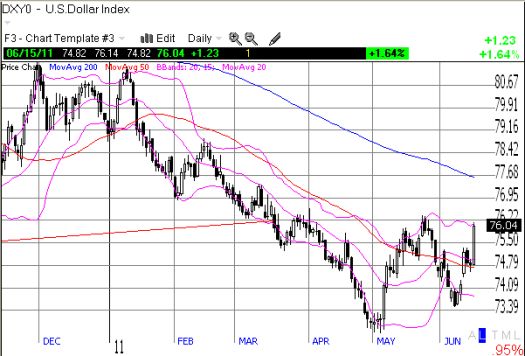
Finally, no surprise that the dollar index surged. Common headlines blame inflation numbers that printed a bit hotter than expected. If this is truly the reason, this is a great place to start fading the dollar because the Federal Reserve has already made it clear that it considers any (near-term) inflation signals as transitory. The Fed is much more worried about poor housing and employment numbers.

Charts below are the latest snapshots of T2108 (and the S&P 500)
Refresh browser if the charts are the same as the last T2108 update.
Daily T2108 vs the S&P 500

Black line: T2108 (measured on the right); Red line: S&P 500 (for comparative purposes)
Weekly T2108

*All charts created using TeleChart:

Related links:
The T2108 Resource Page
Expanded daily chart of T2108 versus the S&P 500
Expanded weekly chart of T2108
Be careful out there!
Full disclosure: long SSO puts, long BAC calls, positioned approximately net neutral on the U.S. dollar
