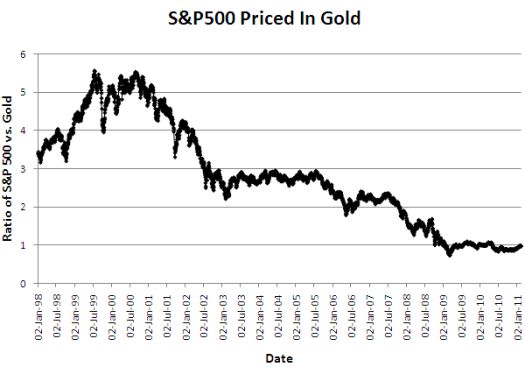
Over the past two days, I have crowed about silver, pondered whether gold will catch up, and marveled at the doubling in the S&P 500 from the March, 2009 lows. Yet, I failed to put the stories together into one chart for proper context: the S&P 500 priced in gold.

Of course, almost every gold bull knows this chart. Gold bears may see a bottoming process in this chart. Regardless, this chart reminds us that the “real” value of the S&P 500 has continued to decline ever since the tech bubble burst in 2000. The two bull markets since then have merely been able to forestall further declines in the stock market. Little real value has materialized.
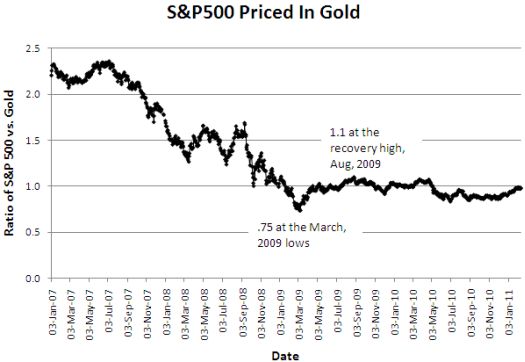
The close-up below shows that instead of a doubling in price, the S&P 500 is up more like 33% since the March, 2009 lows. More importantly, the recovery in the S&P 500 lasted all of five months and has gone nowhere since then. We have the dollar’s decline in value to thank for most of the amazing nominal returns since the March lows.

Source for charts: gold prices from the World Gold Council, S&P 500 prices (adjusted for dividends) from Yahoo! Finance. (Prices through Feb 11, 2011)
The small irony here is that being bullish gold (and silver by extension) is almost the same thing as being bullish the stock market…assuming gold and the S&P 500 sustain their two-year two-step. All things considered, I still strongly prefer the precious metals.
Be careful out there!
Full disclosure: long GG, PAAS, SLV
