Last week produced some ominous chart patterns in important individual stocks. I already covered Google (GOOG) and its rare retest of support at the 50-day moving average (DMA). While I still think GOOG will succeed in its retest in the near-term, I am not so sanguine about other ominous charts.
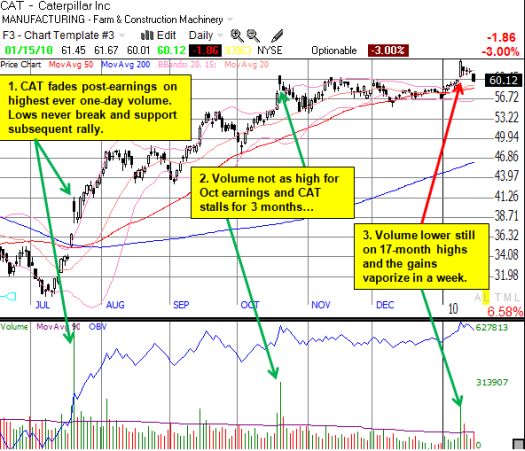
Caterpillar (CAT) survived potential climactic tops in July and October, both triggered by post-earnings trading action. Earnings related news did not trigger last week’s sudden surge in buying and subsequent fade (in fact, I was never able to identify any specific news that could possibly explain the dramatic move, but I figured it was a sign that market participants are not worried about interest rate hikes anytime soon). The trigger was different this time, but the trading response has weakened further after each subsequent potential climactic top.
In July, the lows held on earnings day, and trading volume easily set a new all-time one-day record for CAT. CAT then rallied into October’s earnings. The lows on the day of October’s earnings did not hold, but the lows from the previous day did hold. Trading volume was half as high as July’s record but still about 4x average volume. CAT set a new 14-month high in price. CAT did not rally after October’s earnings and only broke the highs with last week’s one-day surge (and 17-month highs). Volume was 3x average on last Monday’s gap up and 6.3% gain. Friday’s 3% loss completed the roundtrip. Technically, I would assume that move confirmed a climactic top, but I will wait to observe the reaction before/after earnings on January 27 to make a final call.
The graph below summarizes the technical developments.

*Chart created using TeleChart:

Be careful out there!
Full disclosure: no positions

4 thoughts on “A Potential Climactic Top In Caterpillar’s Stock”