

Stock Market Commentary
And now car companies may soon receive tariff relief. The bewildering pace of change in tariff policy continued with an announcement that car companies may get tariff relief, and separate tariffs may be coming soon for semiconductors and pharmaceuticals. This on-going chaos remains a backdrop and a major wildcard to the trading action. To start the week, electronics-related stocks jumped on news on Friday about tariff exemptions. The infectious optimism helped greatly improve market breadth. Still, the takeaway is clear: even if tariffs disappeared tomorrow, they could reappear the next day. So as overhead resistance looms over the major indices, the technicals remind traders and investors of the tension between hopes for an end game and concerns that any end will only be an end for now.
The Stock Market Indices
S&P 500 (SPY)
The S&P 500 gained 0.8% but immediately faded from its gap open, with buyers stopping right below the close of last week’s big surge. Importantly, the index is now contending with its declining 20-day moving average (DMA) (dotted line) combined with presumed resistance around 5506 where the S&P 500 bottomed in mid-March. The fade from these important overhead resistance levels provides an early sign of potential buyer exhaustion.
A week ago, I identified green shoots that hinted at a sustainable low. After the market gapped up the next day, I placed my buy orders roughly halfway between the open and the previous day’s close. That strategy worked well, as two days later nearly all those stocks generated gains equal to a year’s worth of returns in one day. I made that trade an official part of my tariff crash trading strategy. Monday’s trading offered a similar setup. Assuming last week’s low is still a sustainable low, I placed orders at roughly the midpoints between the gap higher and Friday’s close. However, I was much less aggressive given stocks are well above the recent lows now; I even focused on call vertical, diagonal, and calendar spreads over shares. In other words, downside risks are presumably much higher than they were last week.
I repeated that strategy today, though it’s less attractive now because we are nearing the exit from oversold conditions. Buying here is not as compelling for short-term trades, especially due to significant overhead resistance—specifically the 5506 level, which served as a breakdown point and a ceiling during the recent surge. If that breaks, I’ll use the next resistance box above as the next reference point.
NASDAQ (COMPQ)
Overhead resistance looms for the NASDAQ as well. The tech laden index’s rebound brought trading right back to downtrending 20DMA resistance. This resistance behavior echoed across individual stock charts, many of which also hit their 20DMA and then pulled back. The “20DMA resistance” stock scan on Swingtradebot was one of the top scans of the day. My limit order for a diagonal call spread on QQQ filled (April 25 $474/ April 17 $475).
")
The iShares Russell 2000 ETF (IWM)
I have essentially put IWM on trading ice. The ETF of small caps is presumably trapped between two key levels: the pre-pandemic high at the lower end and the bear market line at the upper end. I did not even look at IWM for trade setups: I expect more range-bound movement between those levels.
")
The Short-Term Trading Call While Overhead Resistance Looms
- AT50 (MMFI) = 17.7% of stocks are trading above their respective 50-day moving averages (oversold day #8)
- AT200 (MMTH) = 23.9% of stocks are trading above their respective 200-day moving averages
- Short-term Trading Call: bullish
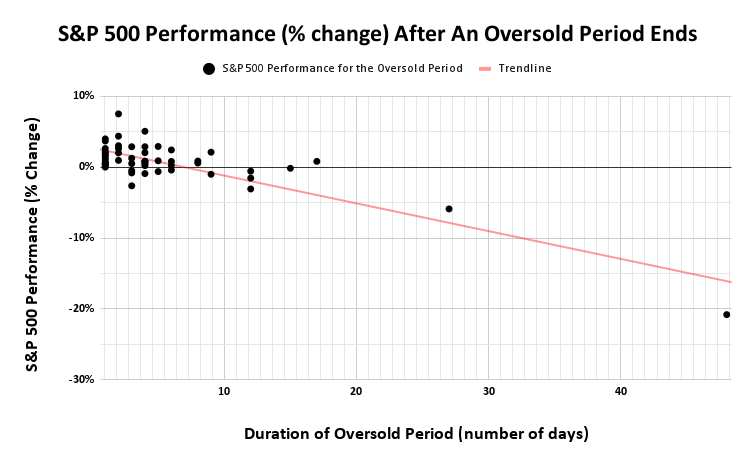
AT50 (MMFI), the percentage of stocks trading above their 50DMAs, closed at 17.7%. Market breadth improved significantly, but time is ticking. My favorite technical indicator has now been oversold for 8 days. The longer AT50 remains oversold, the more bearish the outlook becomes for the indices. In fact, the prospects for a new low seem high (see my Seeking Alpha article “A Rare Signal Suggests A Final Market Bottom Is Not Here Yet“). Per the chart below, there have been only NINE oversold periods longer than this one (since 1950)! Beyond 10 days, I will officially worry that this oversold period will include a new low.
The volatility index (VIX) placed its vote of confidence in a sustainable low. The VIX remains very elevated, but Monday’s trading delivered a follow-through on last week’s first volatility implosion. While I don’t expect a straight-line decline from here, I do expect the VIX to generally trend lower over time…like a race between normalization and residual volatility forcing stocks lower as overhead resistance looms.
The Equities: Overhead Resistance Looms
Apple Inc (AAPL)
AAPL and other electronics companies rallied on Monday following the tariff blink on electronics, including smartphones. Yet, even AAPL faded sharply from its gap open. The stock initially broke out above its downtrending 20DMA, but overhead resistance from March’s low proved too challenging. Toward the low of the day, I opened a calendar spread on AAPL using the $215 strike. I targeted a spot high enough to watch the short end expire worthless while providing runway for the long end to run up next week on a discount.
iShares
")
Be careful out there!
Footnotes
Subscribe for free to get email notifications of future posts!
“Above the 50” (AT50) uses the percentage of stocks trading above their respective 50-day moving averages (DMAs) to measure breadth in the stock market. Breadth defines the distribution of participation in a rally or sell-off. As a result, AT50 identifies extremes in market sentiment that are likely to reverse. Above the 50 is my alternative name for “MMFI” which is a symbol TradingView.com and other chart vendors use for this breadth indicator. Learn more about AT50 on my Market Breadth Resource Page. AT200, or MMTH, measures the percentage of stocks trading above their respective 200DMAs.
Active AT50 (MMFI) periods: Day #8 under 20% (oversold), Day #12 under 30%, Day #33 under 40%, Day #45 under 50%, Day #70 under 60%, Day #171 under 70%
Source for charts unless otherwise noted: TradingView.com
Full disclosure: long SPY shares, long SPY put spread, long IWM, long AAPL calendar call spread, long QQQ calendar diagonal call spread
FOLLOW Dr. Duru’s commentary on financial markets via StockTwits, BlueSky, and even Instagram!
*Charting notes: Stock prices are not adjusted for dividends. Candlestick charts use hollow bodies: open candles indicate a close higher than the open, filled candles indicate an open higher than the close.
* Blog notes: this blog was written based on the heavily edited transcript of the following video that includes a live review of the stock charts featured in this post. I used ChatGPT to process the transcript.