Stock Market Commentary
Imagine that. Key support holds firm across the major indices. A telling post-election reversal turned into proof positive that unrelenting bulls remain all-in for the stock market. Not even a further escalation in World War 3 brought pause to the rebounds off support (Russia fired an intermediate-range ballistic missile into Ukraine and warned other countries could be targets after the U.S. gave Ukraine permission to fire U.S. missiles into Russia). With Thanksgiving expanding into a week of Black Friday shopping and travel, I expect the good cheer to persist even if the mood does not translate into a fresh surge in the indices. Accordingly, all but the most extreme bad news should barely register on trading.
The Stock Market Indices
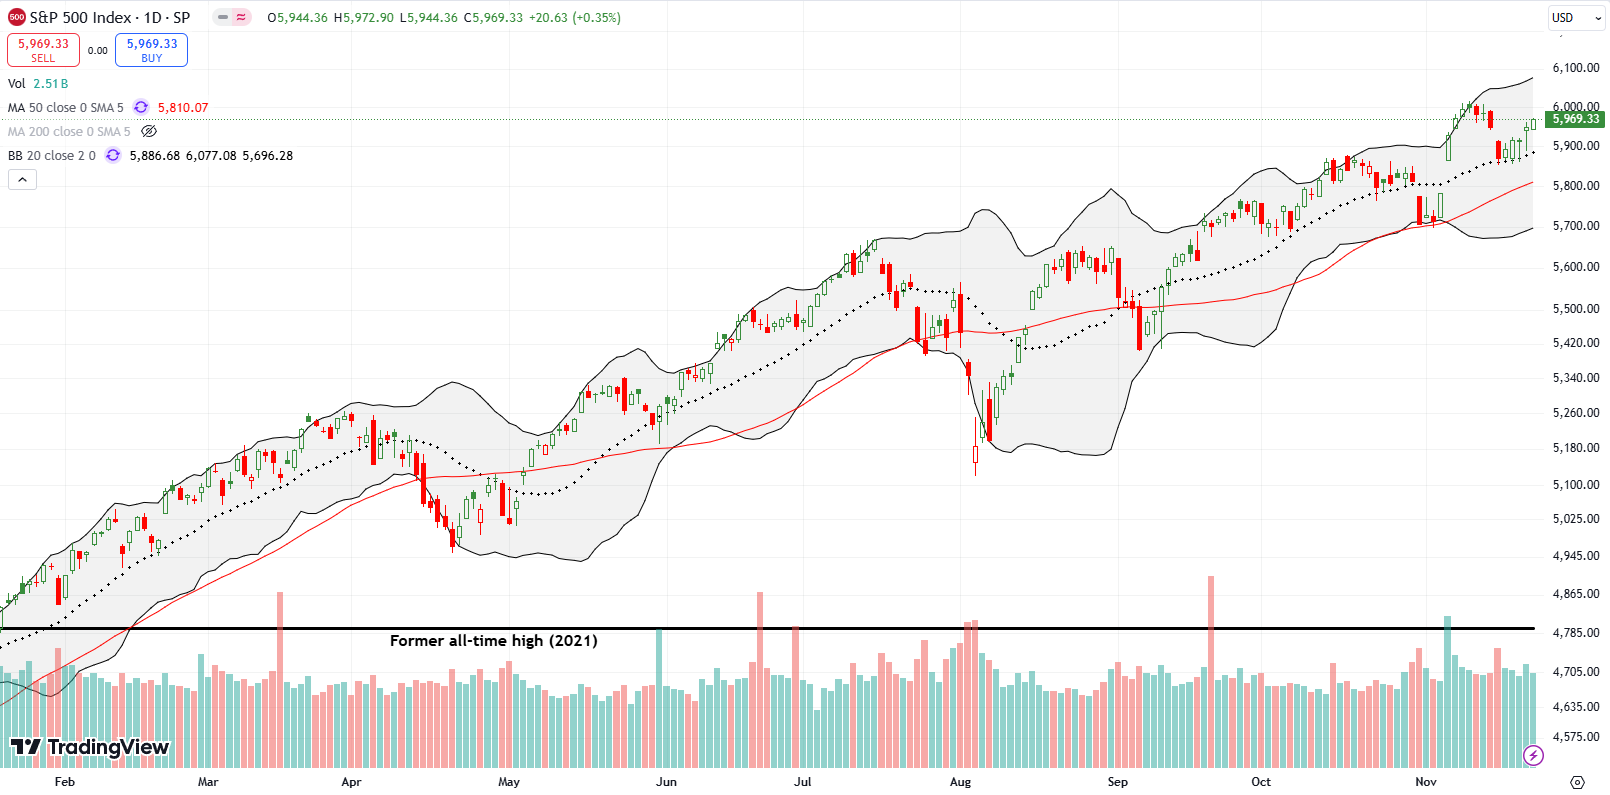
The S&P 500 (SPY) ended the previous week sitting right on top of support at its 20-day moving average (DMA) (the dashed line). The index touched and held that support for the next 4 days. The last 3 days of trading held separation from support, and the index now looks ready to retest and pass its all-time high.
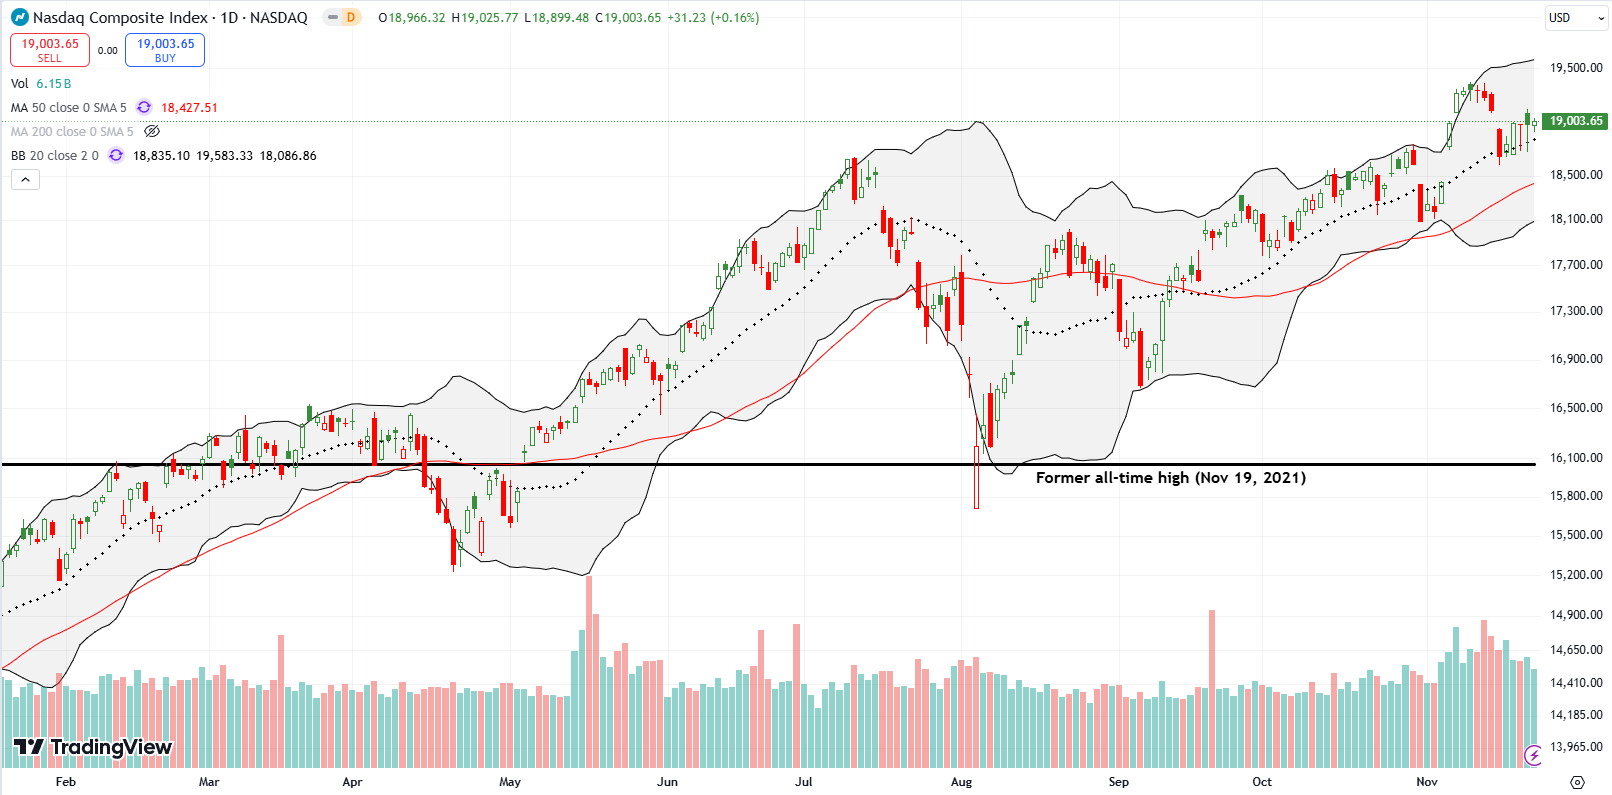
The NASDAQ (COMPQX) also held 20DMA support although the tech laden index had some minor slips. The NASDAQ also failed to close the gap from the previous Friday’s loss. Big cap tech and semiconductor stocks weighed a bit on the NASDAQ.
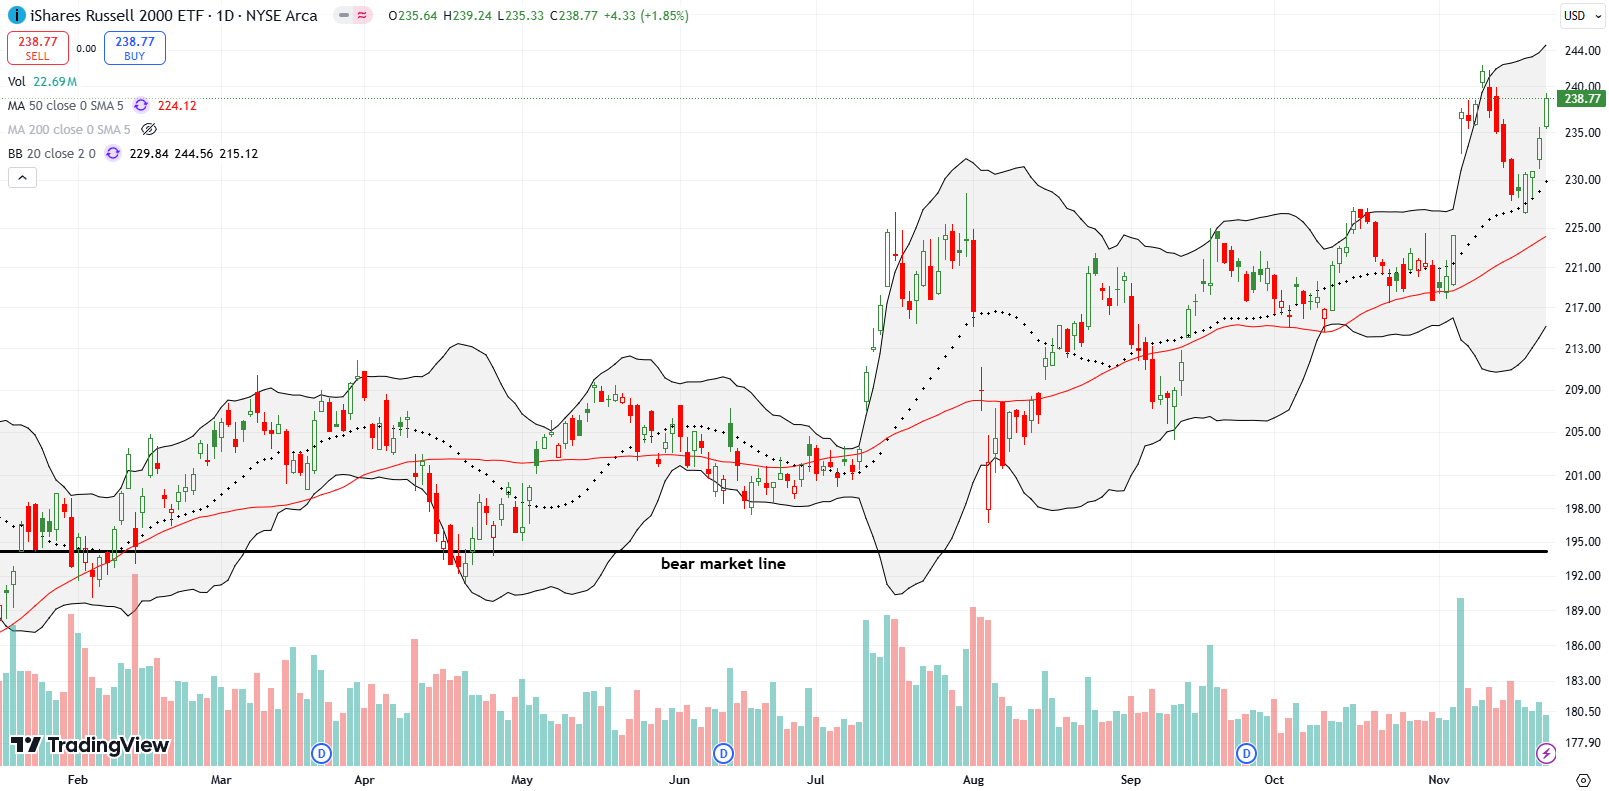
The iShares Russell 2000 ETF (IWM) outperformed with the most convincing confirmation of 20DMA support. IWM surged 4.5% for the week after opening ever so slightly below 20DMA support on Tuesday. I added to my IWM call on Tuesday’s open and took profits on the entire position on Thursday’s jump. IWM looks ready to challenge its previous high. If IWM breaks out, the ETF of small caps should quickly leave its all-time high behind.
The Short-Term Trading Call When Support Holds Firm
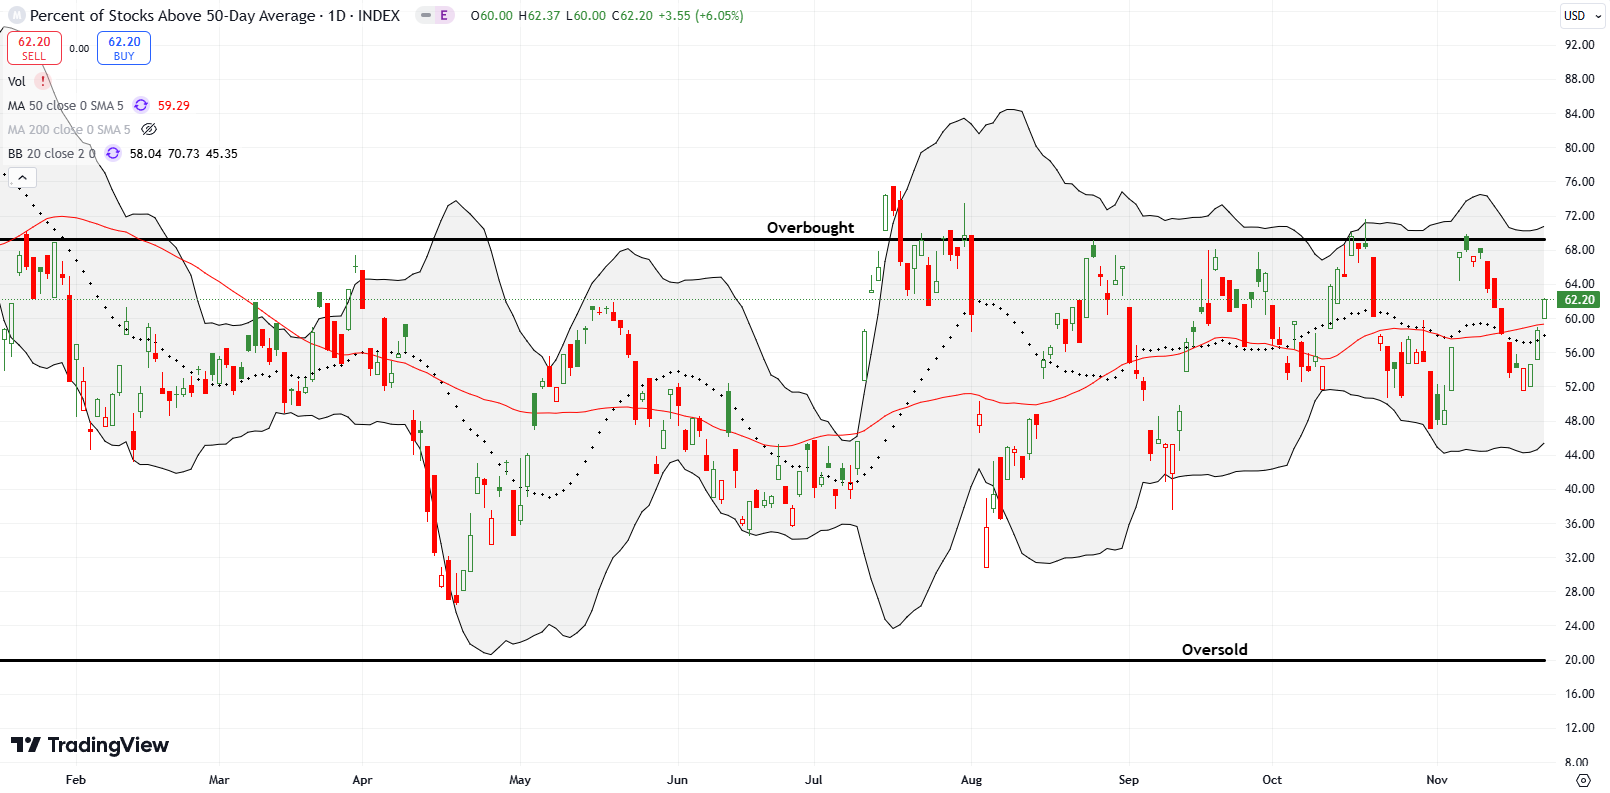
- AT50 (MMFI) = 62.2% of stocks are trading above their respective 50-day moving averages
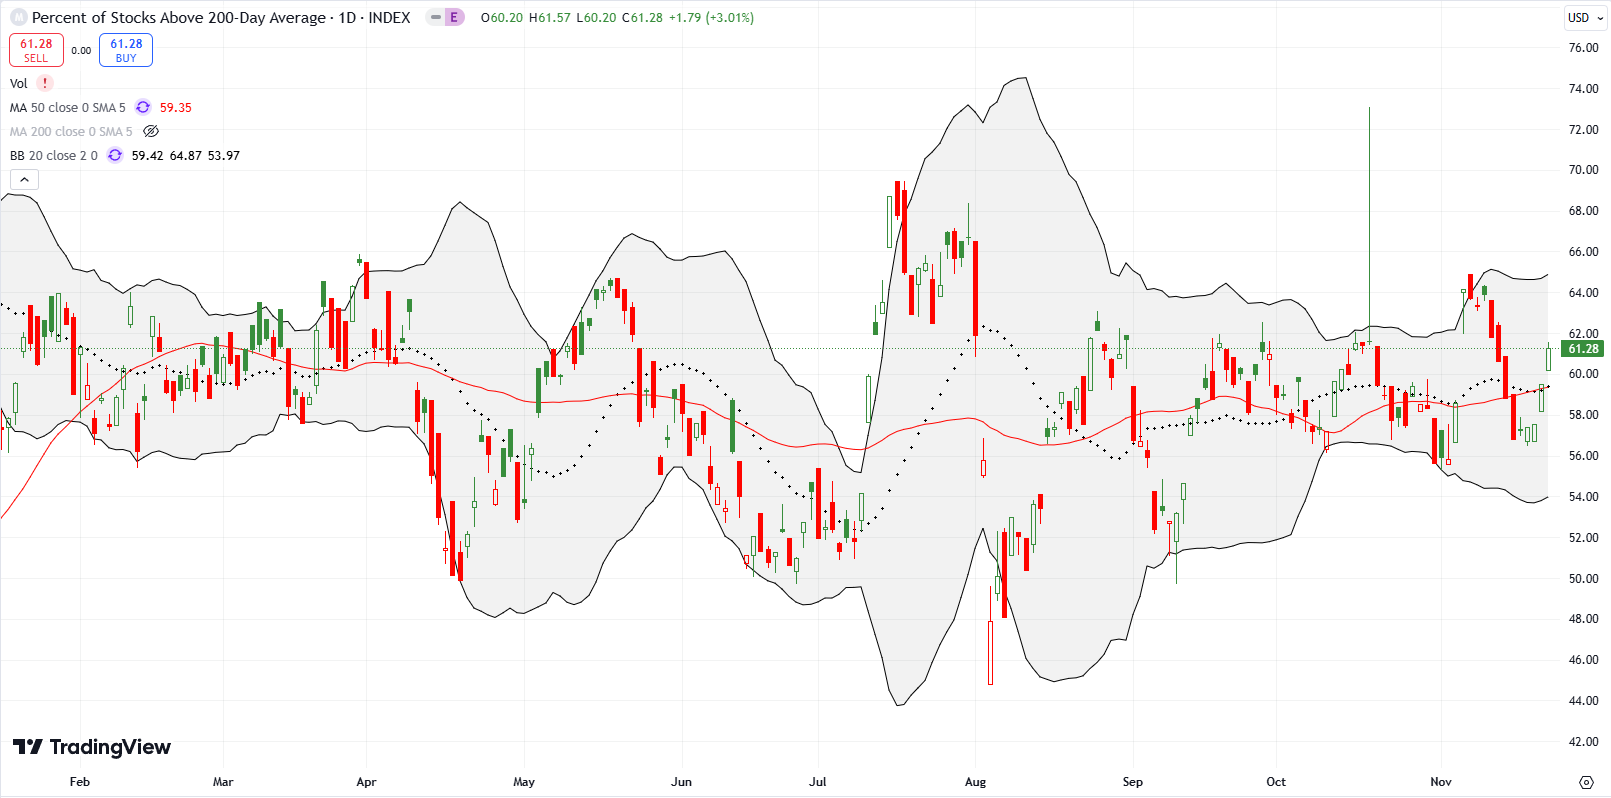
- AT200 (MMTH) = 61.3% of stocks are trading above their respective 200-day moving averages
- Short-term Trading Call: neutral
AT50 (MMFI), the percentage of stocks trading above their respective 50DMAs, closed at 62.2% after following IWM’s lead. My favorite technical indicator looks set to do yet another tease with resistance at the overbought threshold (70%). I left the short-term trading call at neutral even though the broad confirmation of 20DMA supports was a bullish sign for the stock market as a whole.
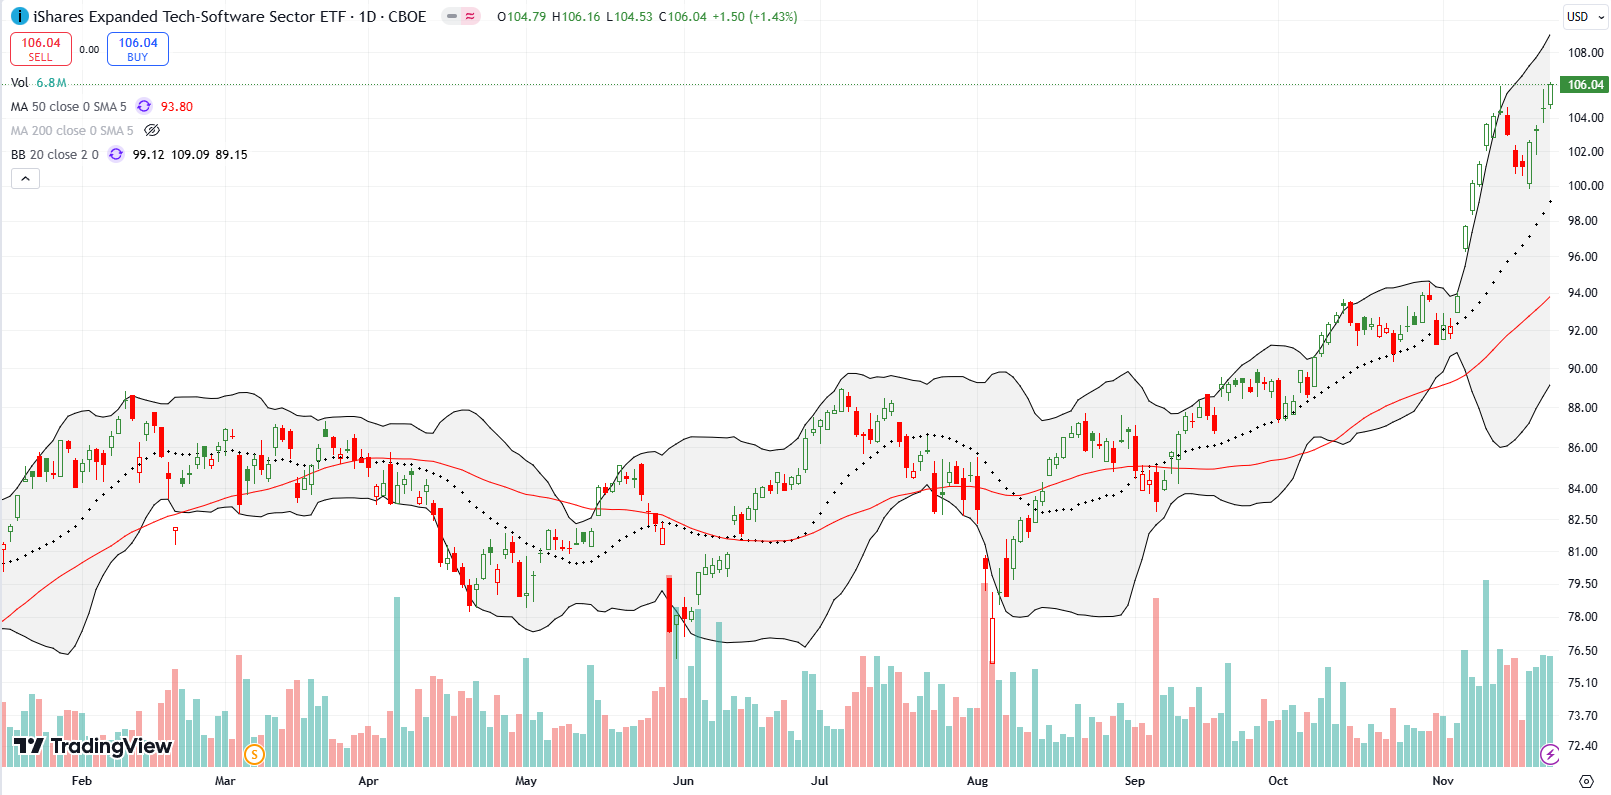
An all-time high for the iShares Expanded Tech Software Sector ETF (IGV) accompanied IWM as a key bullish sign across a swath of smaller stocks. IGV pulled off a bullish engulfing bottom on Tuesday and was off to the races from there. Clearly, traders and investors are doing some holiday shopping in stocks that get less coverage. I expect the rally to slow down as the 20DMA uptrend plays “catch-up”.
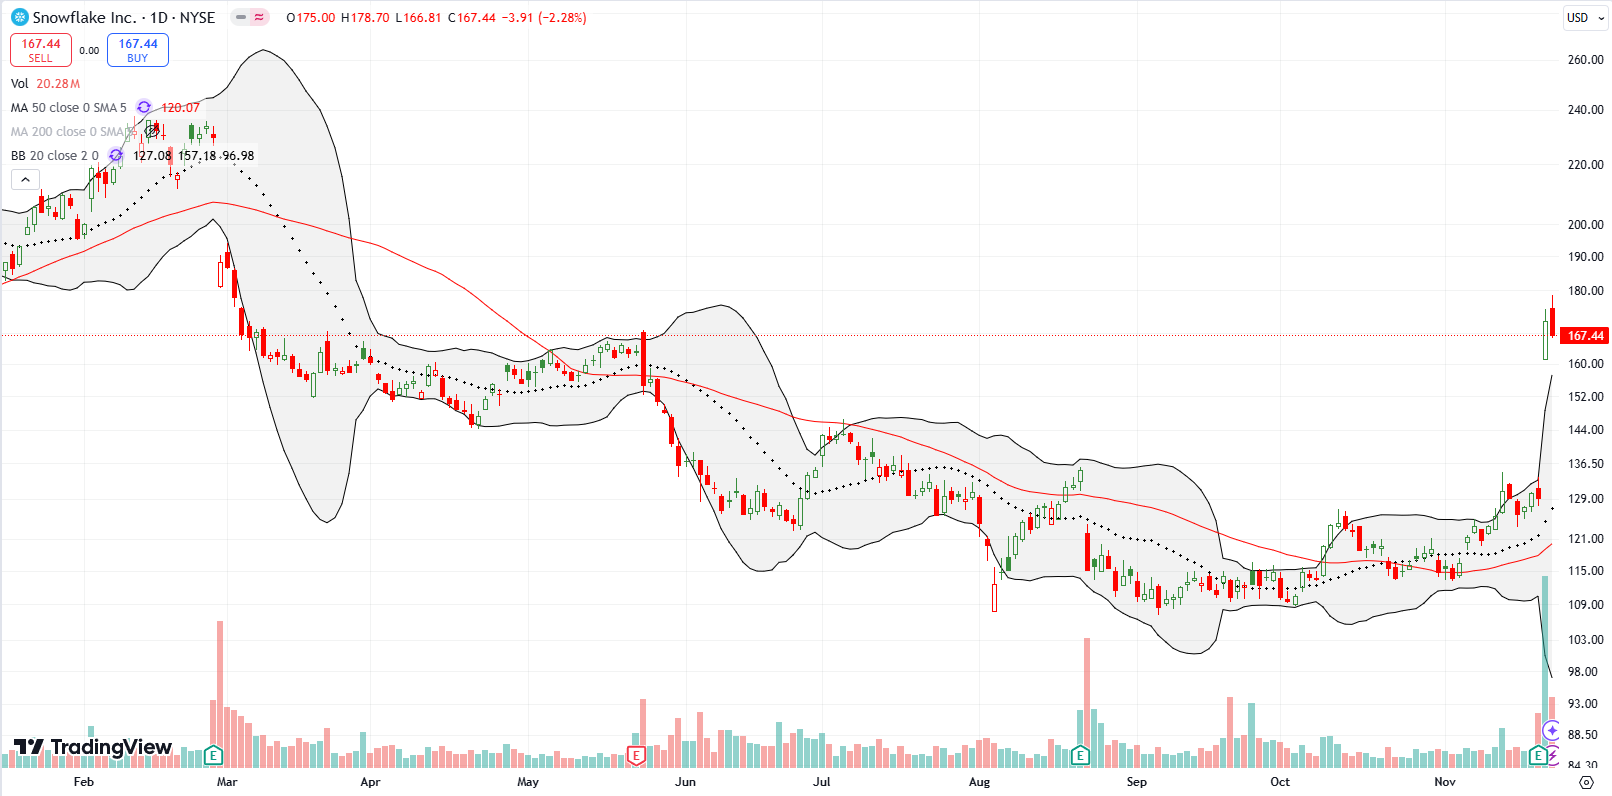
Database software company Snowflake, Inc (SNOW) was one of my “turn-around” stocks. Last month I made the case for adding to my shares. Major insider stock purchases are a key tell. Still, I gulped hard ahead of earnings. Much to my delight, I received an early holiday present. SNOW surged 32.7% post-earnings and closed the week at a 9-month high, just above the May highs. I took profits on the entire position. Needless to say SNOW is a buy on the dips from here.
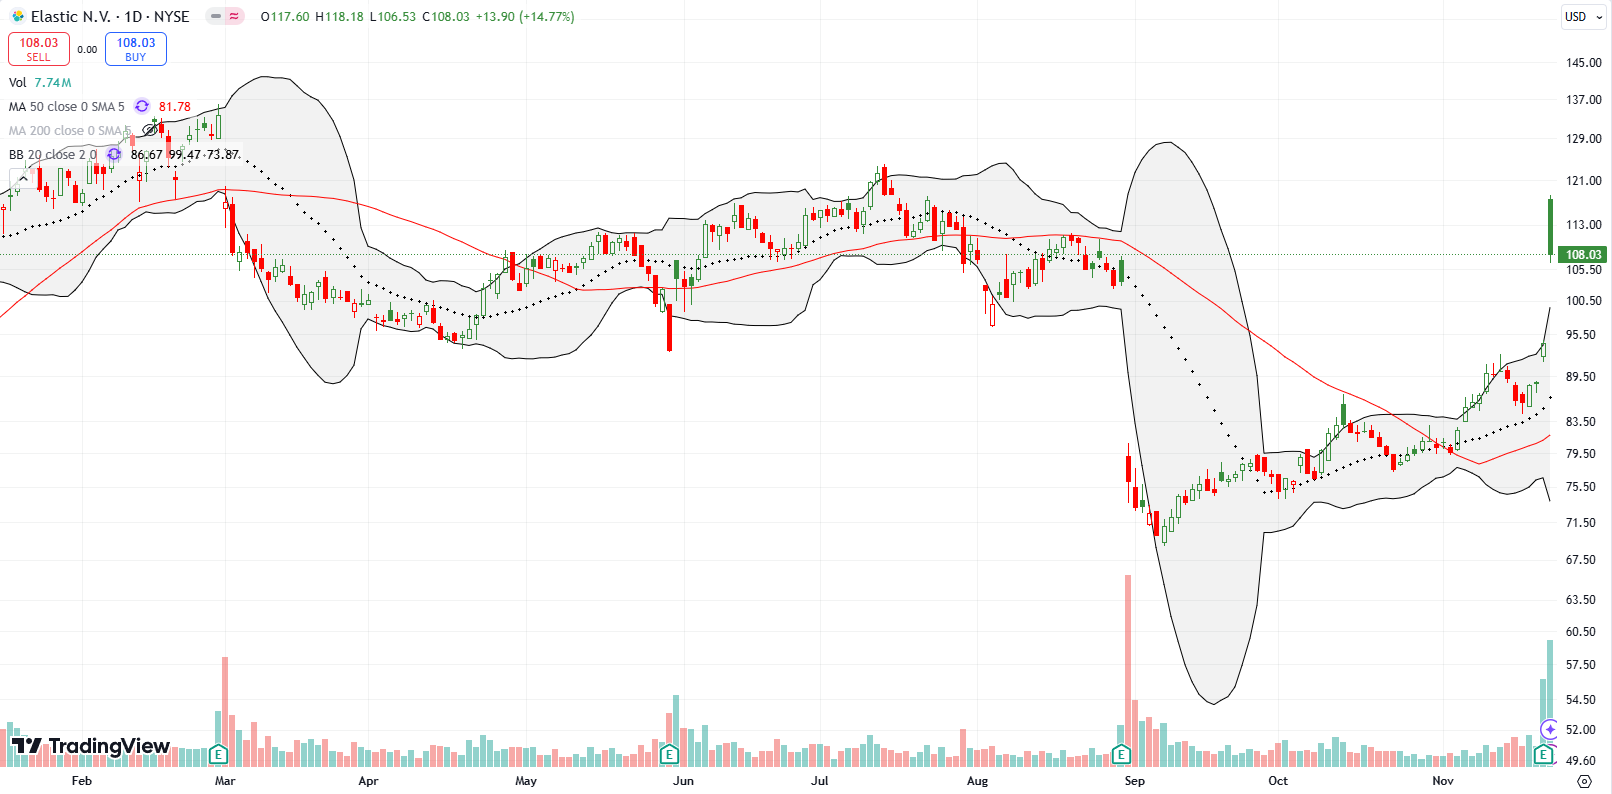
With the success of SNOW and a relative reminding me about a sharp rebound in content delivery network (CDN) software company Akami (AKAM), I dared to do a bullish pre-earnings trade on Elastic (ESTC). I sold a put and opened a calendar call spread. After a 24.9% open, I closed out the nearly worthless put option and eventually took profits on the calendar call spread. This case was just one of the fortuitous scenarios where I connected the dots all in the right way. ESTC faded to a 14.8% post-earnings close. Still, it is in a more bullish position now that it has fully reversed the large gap down from August earnings.
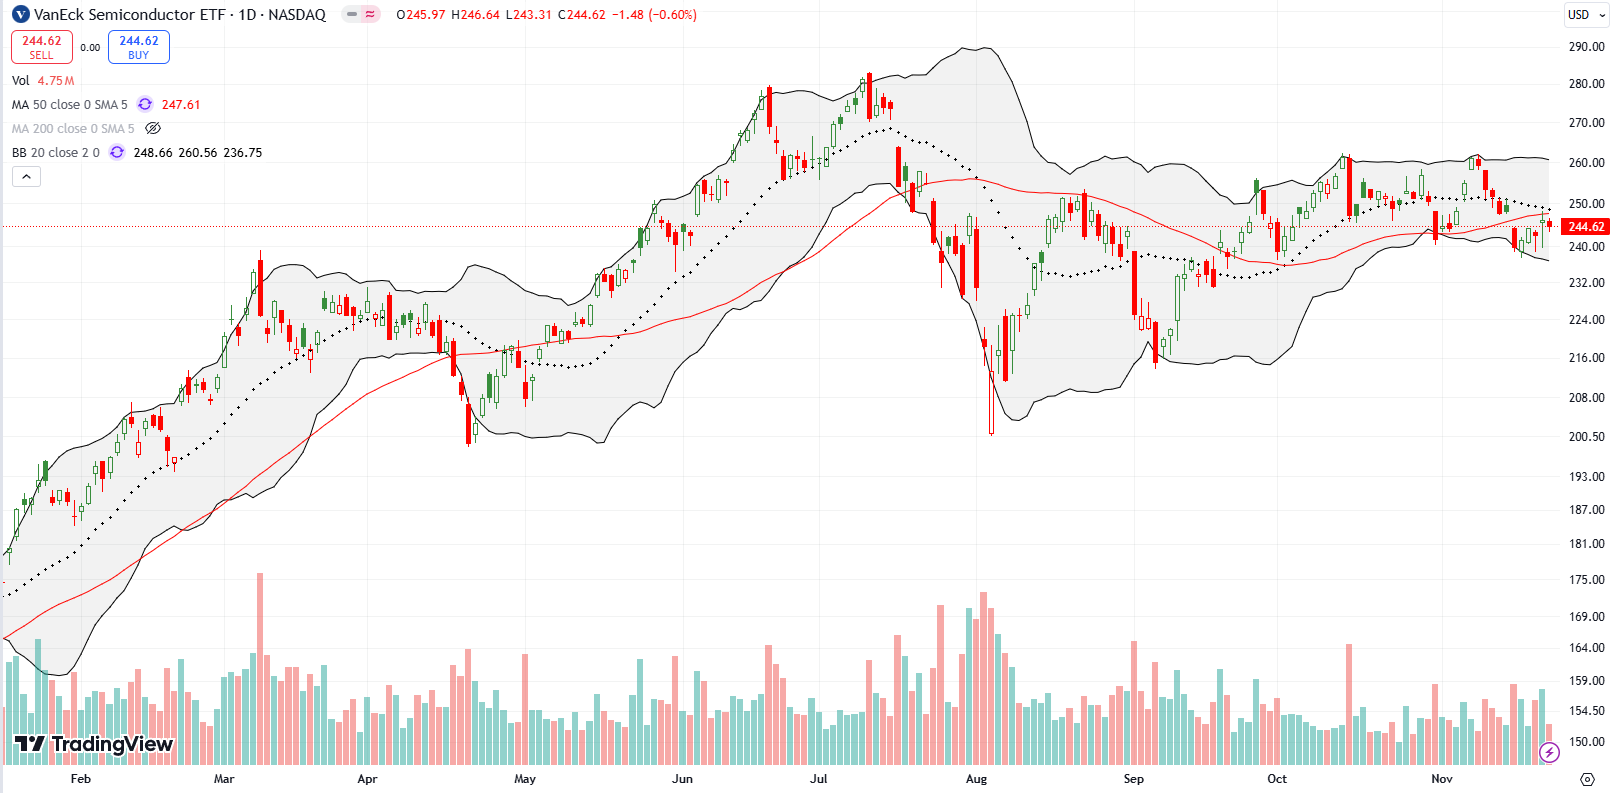
The VanEck Semiconductor ETF (SMH) continued a second week of surprising weakness. SMH struggled all week to challenge 50DMA resistance (the red line) and now faces converged resistance from the 20DMA. SMH looks set to continue lagging especially with earnings from NVIDIA Corporation (NVDA) failing to generate fresh market excitement in semiconductors.
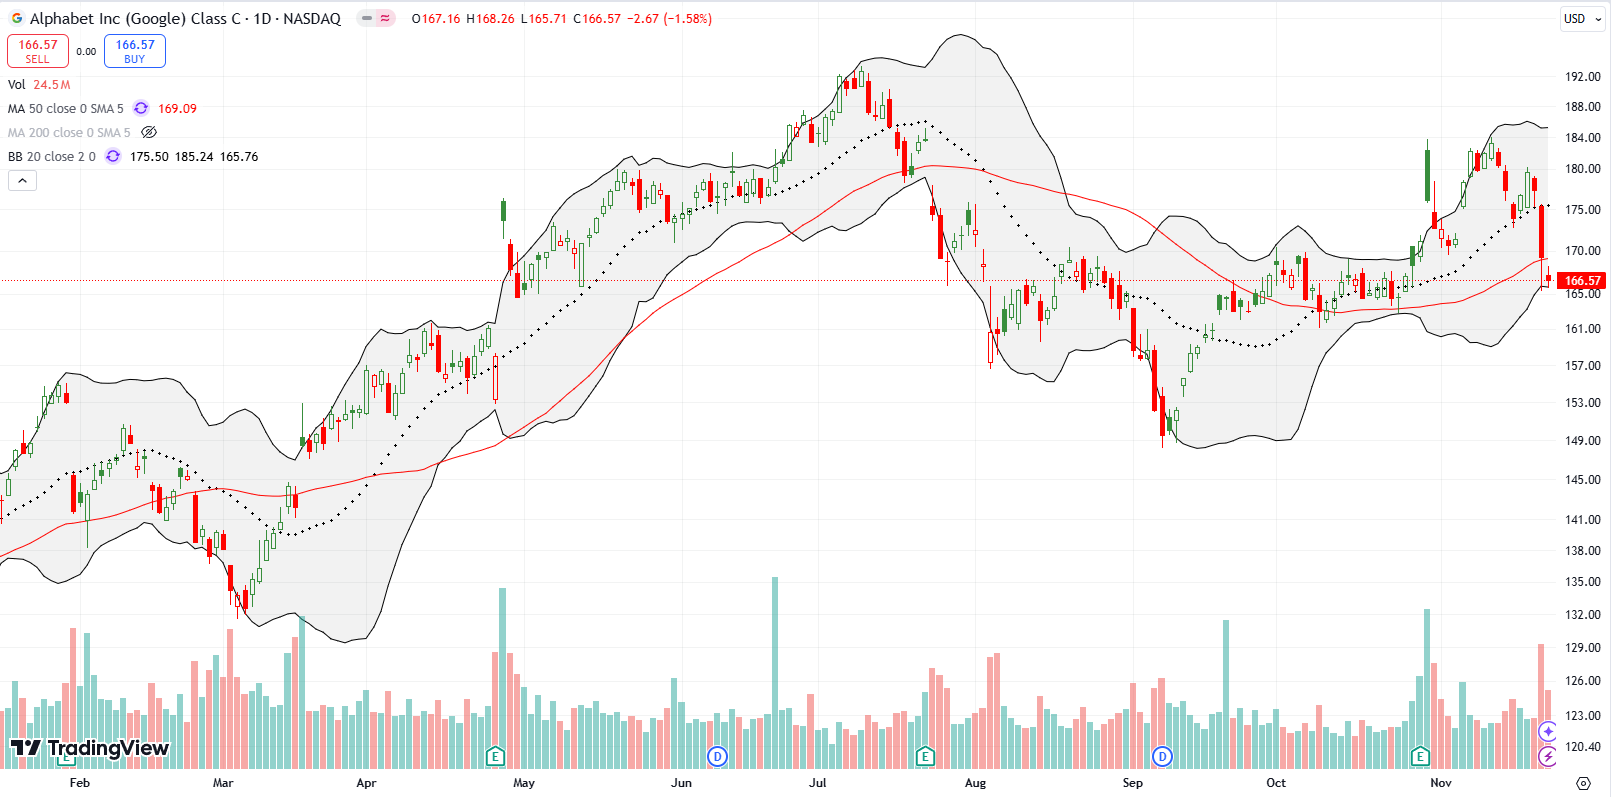
The Department of Justice made its antagonism against Alphabet Inc (GOOG) official. The DoJ asked the courts to force Google disgorge its Chrome browser, potentially release its hold on the Android operating system, cease paying Apple (AAPL) for a privileged search position in the Apple ecosystem among many other anti-trust remedies. Even as the possibilities loomed over the stock, it took the actual news to get traders and investors to flee. GOOG fell 4.6% and closed on top of 50DMA support. On Friday, GOOG closed below 50DMA support. Since the Chrome browser makes no money (directly), I am skeptical any company would want to buy Chrome. Moreover, taking down Google will undoubtedly give other big tech competitors stronger positions in their own businesses…especially if one of THEM buys Chrome. The DoJ is playing big tech whack-a-mole.
I got caught with my hand in the GOOG cookie jar with call options. A bounce off 20DMA support was playing out in picture-perfect form until the news dropped.
Be careful out there!
Footnotes
Subscribe for free to get email notifications of future posts!
“Above the 50” (AT50) uses the percentage of stocks trading above their respective 50-day moving averages (DMAs) to measure breadth in the stock market. Breadth defines the distribution of participation in a rally or sell-off. As a result, AT50 identifies extremes in market sentiment that are likely to reverse. Above the 50 is my alternative name for “MMFI” which is a symbol TradingView.com and other chart vendors use for this breadth indicator. Learn more about AT50 on my Market Breadth Resource Page. AT200, or MMTH, measures the percentage of stocks trading above their respective 200DMAs.
Active AT50 (MMFI) periods: Day #251 over 20%, Day #150 over 30%, Day #74 over 40%, Day #12 over 50%, Day #1 over 60% (overperiod), Day #89 under 70% (underperiod)
Source for charts unless otherwise noted: TradingView.com
Full disclosure: long SPY put spread, long IWM shares, long QQQ put spread, long SMH put spread, long AKAM
FOLLOW Dr. Duru’s commentary on financial markets via StockTwits, BlueSky, and even Instagram!
*Charting notes: Stock prices are not adjusted for dividends. Candlestick charts use hollow bodies: open candles indicate a close higher than the open, filled candles indicate an open higher than the close.


I like your insight that the DoJ is effectively playing whack-a-mole with Big Tech. But someone had to start pushing back at some point. Europe has really taken the lead with user privacy protections and anti-monopoly regulation; the U.S. is playing catch-up from far behind.
For what it’s worth, Chrome is extremely effective spyware. During installation it sends Google a fingerprint that uniquely identifies your computer to any website that uses Google’s web toolset, based on everything about your computer from installed fonts and apps to operating system version. It updates that fingerprint – and Google – when you change any of those things. This is all checked _hourly_.
For Chrome, we have precedence. After the government got hot and bothered about Microsoft’s browser dominance with Internet Explorer, Google moved in. Maybe Microsoft makes an even bigger comeback after DoJ hinders Google’s business. Or maybe Safari will win. I just can’t see Firefox or any number of the smaller players winning. I don’t see the economic or market logic that concludes Chrome has won because of Google’s dominance in search. But I can see how ripping Chrome away will hurt Google’s search business. However, the biggest irony will be watching the market scramble to rediscover Google search as alternatives still prove themselves to be inferior in quality of results….unless the government plans on subsidizing search companies so they can drop their reliance on search advertising to stay in business. Another motivator could be to prevent Google from dominating AI search…but then it just paves the way for OpenAI or some other unknown company to dominate. It takes a lot of resources to run these businesses both from technology costs and regulatory costs…and the big tech companies are the ones with sufficient resources…unless of again the government plans on subsidizing competitors or even regulating these services as national utilities…
Europe’s privacy efforts are laudable, but they also have nationalistic motivations to reduce the ability of American companies to dominate their markets.
Not to mention a favorite extortion target when the EU needs some running around money…..